Perfil del mercado coreano de Maderas Aserradas de ConÃferas
Perfil del mercado coreano de Maderas Aserradas de ConÃferas
Perfil del mercado coreano de Maderas Aserradas de ConÃferas
- No tags were found...

You also want an ePaper? Increase the reach of your titles
YUMPU automatically turns print PDFs into web optimized ePapers that Google loves.
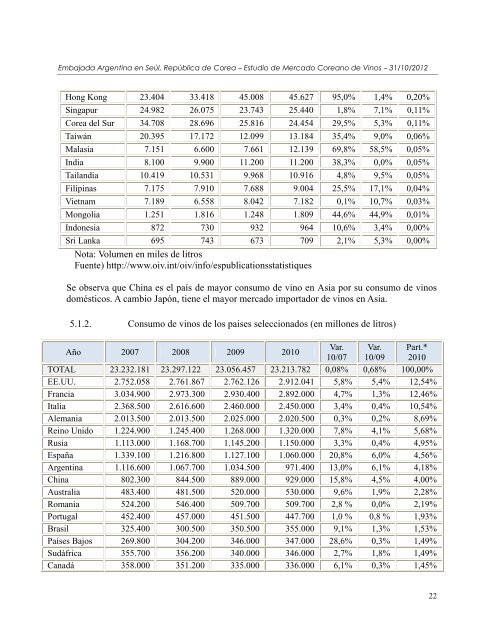
Embajada Argentina en Seúl, República <strong>de</strong> Corea – Estudio <strong>de</strong> Mercado Coreano <strong>de</strong> Vinos – 31/10/2012Hong Kong 23.404 33.418 45.008 45.627 95,0% 1,4% 0,20%Singapur 24.982 26.075 23.743 25.440 1,8% 7,1% 0,11%Corea <strong><strong>de</strong>l</strong> Sur 34.708 28.696 25.816 24.454 29,5% 5,3% 0,11%Taiwán 20.395 17.172 12.099 13.184 35,4% 9,0% 0,06%Malasia 7.151 6.600 7.661 12.139 69,8% 58,5% 0,05%India 8.100 9.900 11.200 11.200 38,3% 0,0% 0,05%Tailandia 10.419 10.531 9.968 10.916 4,8% 9,5% 0,05%Filipinas 7.175 7.910 7.688 9.004 25,5% 17,1% 0,04%Vietnam 7.189 6.558 8.042 7.182 0,1% 10,7% 0,03%Mongolia 1.251 1.816 1.248 1.809 44,6% 44,9% 0,01%Indonesia 872 730 932 964 10,6% 3,4% 0,00%Sri Lanka 695 743 673 709 2,1% 5,3% 0,00%Nota: Volumen en miles <strong>de</strong> litrosFuente) http://www.oiv.int/oiv/info/espublicationsstatistiquesSe observa que China es el país <strong>de</strong> mayor consumo <strong>de</strong> vino en Asia por su consumo <strong>de</strong> vinosdomésticos. A cambio Japón, tiene el mayor <strong>mercado</strong> importador <strong>de</strong> vinos en Asia.5.1.2. Consumo <strong>de</strong> vinos <strong>de</strong> los paises seleccionados (en millones <strong>de</strong> litros)Año 2007 2008 2009 2010Var. Var. Part.*10/07 10/09 2010TOTAL 23.232.181 23.297.122 23.056.457 23.213.782 0,08% 0,68% 100,00%EE.UU. 2.752.058 2.761.867 2.762.126 2.912.041 5,8% 5,4% 12,54%Francia 3.034.900 2.973.300 2.930.400 2.892.000 4,7% 1,3% 12,46%Italia 2.368.500 2.616.600 2.460.000 2.450.000 3,4% 0,4% 10,54%Alemania 2.013.500 2.013.500 2.025.000 2.020.500 0,3% 0,2% 8,69%Reino Unido 1.224.900 1.245.400 1.268.000 1.320.000 7,8% 4,1% 5,68%Rusia 1.113.000 1.168.700 1.145.200 1.150.000 3,3% 0,4% 4,95%España 1.339.100 1.216.800 1.127.100 1.060.000 20,8% 6,0% 4,56%Argentina 1.116.600 1.067.700 1.034.500 971.400 13,0% 6,1% 4,18%China 802.300 844.500 889.000 929.000 15,8% 4,5% 4,00%Australia 483.400 481.500 520.000 530.000 9,6% 1,9% 2,28%Romania 524.200 546.400 509.700 509.700 2,8 % 0,0% 2,19%Portugal 452.400 457.000 451.500 447.700 1,0 % 0,8 % 1,93%Brasil 325.400 300.500 350.500 355.000 9,1% 1,3% 1,53%Países Bajos 269.800 304.200 346.000 347.000 28,6% 0,3% 1,49%Sudáfrica 355.700 356.200 340.000 346.000 2,7% 1,8% 1,49%Canadá 358.000 351.200 335.000 336.000 6,1% 0,3% 1,45%22