Versión 3.0 previa a revision final de autores

Create successful ePaper yourself
Turn your PDF publications into a flip-book with our unique Google optimized e-Paper software.
Cár<strong>de</strong>nas, T. M.<br />
LA PARTICIPACIÓN DE LAS MUJERES INVESTIGADORAS EN<br />
MÉXICO<br />
4,500<br />
4,000<br />
3,500<br />
3,000<br />
2,500<br />
2,000<br />
1,500<br />
1,000<br />
500<br />
-<br />
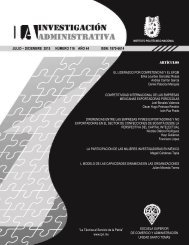
Total <strong>de</strong> investigadores S.N.I. por área <strong>de</strong> conocimiento<br />
1 2 3 4 5 6 7<br />
2012 3,004 3,160 1,914 2,773 2,745 2,178 2,778<br />
2013 3,459 3,703 2,239 3,125 3,343 2,443 3,047<br />
2015 3,780 3,988 2,511 3,384 3,673 2,613 3,367<br />
Fuente: elaboración propia con base en S.N.I. CONACYT (2012, 2013 y 2015).<br />
En el cuadro 2 se presenta el total <strong>de</strong> investigadores<br />
activos en los años 2012, 2013 y 2015, el cuadro está<br />
clasificado por área y género. La mayor participación <strong>de</strong><br />
mujeres investigadores es en el área 2 Biología y Química,<br />
seguida <strong>de</strong>l área 4 Humanida<strong>de</strong>s y Ciencias <strong>de</strong> la<br />
Conducta y el área 5 Ciencias Sociales y Economía. El<br />
área con menor participación <strong>de</strong> mujeres son las áreas 1<br />
Física, Matemáticas y ciencias <strong>de</strong> la Tierra y el área 7 <strong>de</strong><br />
Ingeniería e Industria.<br />
70<br />
Cuadro 2. Investigadores S.N.I. por área y género 2012, 2013 y 2015<br />
Total <strong>de</strong> Investigadores por Área y por Género<br />
2012 2013 2015<br />
ÁREA F M Total F M Total F M Total<br />
1 561 2,443 3,004 675 2,784 3,459 776 3,004 3,780<br />
2 1,291 1,869 3,160 1,581 2,122 3,703 1,699 2,289 3,988<br />
3 854 1,060 1,914 1,043 1,196 2,239 1,179 1,332 2,511<br />
4 1,332 1,441 2,773 1,538 1,587 3,125 1,685 1,699 3,384<br />
5 975 1,770 2,745 1,219 2,124 3,343 1,352 2,321 3,673<br />
6 648 1,530 2,178 770 1,673 2,443 855 1,758 2,613<br />
7 548 2,230 2,778 617 2,430 3,047 699 2,668 3,367<br />
Total<br />
general<br />
6,209 12,343 18,552 7,443 13,916 21,359 8245 15071 23,316<br />
Fuente: elaboración propia con base en S.N.I. CONACYT (2012, 2013 y 2015).<br />
En la gráfica 6 se presenta un comparativo <strong>de</strong><br />
investigadores S.N.I. por los cuatro niveles: candidato,<br />
nivel I, nivel II y nivel III, la gráfica está clasificada por<br />
género y por los tres años analizados. Se pue<strong>de</strong><br />
observar claramente que en ninguno <strong>de</strong> los cuatro<br />
niveles, la participación <strong>de</strong> las mujeres es mayor; su<br />
participación se concentra básicamente en el nivel<br />
candidato y nivel I, en cuanto a los niveles II y III la<br />
participación <strong>de</strong> las mujeres disminuye<br />
consi<strong>de</strong>rablemente. Aunque <strong>de</strong> acuerdo al análisis las<br />
mujeres han avanzado en promedio un punto porcentual<br />
en el periodo analizado.<br />
Gráfica 6. Investigadores S.N.I. por nivel y género 2012, 2013 y 2015<br />
#116 / Año 44<br />
INVESTIGACIÓN ADMINISTRATIVA AÑO: 44 NÚM. 116 ISSN: 1870-6614