Versión 3.0 previa a revision final de autores

You also want an ePaper? Increase the reach of your titles
YUMPU automatically turns print PDFs into web optimized ePapers that Google loves.
Cár<strong>de</strong>nas, T. M.<br />
LA PARTICIPACIÓN DE LAS MUJERES INVESTIGADORAS EN<br />
MÉXICO<br />
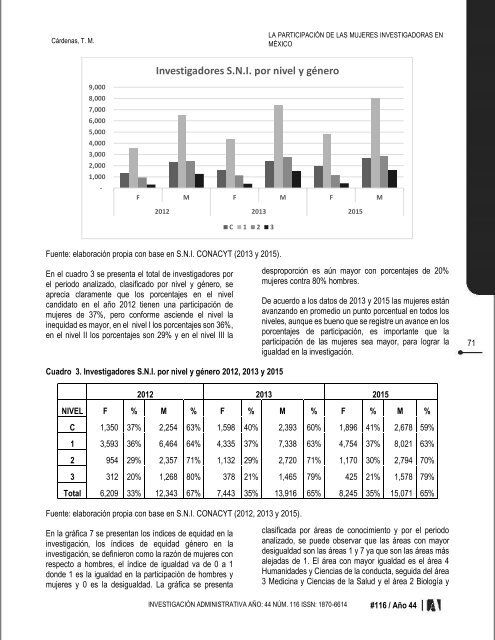
Investigadores S.N.I. por nivel y género<br />
9,000<br />
8,000<br />
7,000<br />
6,000<br />
5,000<br />
4,000<br />
3,000<br />
2,000<br />
1,000<br />
-<br />
F M F M F M<br />
2012 2013 2015<br />
C 1 2 3<br />
Fuente: elaboración propia con base en S.N.I. CONACYT (2013 y 2015).<br />
En el cuadro 3 se presenta el total <strong>de</strong> investigadores por<br />
el periodo analizado, clasificado por nivel y género, se<br />
aprecia claramente que los porcentajes en el nivel<br />
candidato en el año 2012 tienen una participación <strong>de</strong><br />
mujeres <strong>de</strong> 37%, pero conforme ascien<strong>de</strong> el nivel la<br />
inequidad es mayor, en el nivel I los porcentajes son 36%,<br />
en el nivel II los porcentajes son 29% y en el nivel III la<br />
<strong>de</strong>sproporción es aún mayor con porcentajes <strong>de</strong> 20%<br />
mujeres contra 80% hombres.<br />
De acuerdo a los datos <strong>de</strong> 2013 y 2015 las mujeres están<br />
avanzando en promedio un punto porcentual en todos los<br />
niveles, aunque es bueno que se registre un avance en los<br />
porcentajes <strong>de</strong> participación, es importante que la<br />
participación <strong>de</strong> las mujeres sea mayor, para lograr la<br />
igualdad en la investigación.<br />
71<br />
Cuadro 3. Investigadores S.N.I. por nivel y género 2012, 2013 y 2015<br />
2012 2013 2015<br />
NIVEL F % M % F % M % F % M %<br />
C 1,350 37% 2,254 63% 1,598 40% 2,393 60% 1,896 41% 2,678 59%<br />
1 3,593 36% 6,464 64% 4,335 37% 7,338 63% 4,754 37% 8,021 63%<br />
2 954 29% 2,357 71% 1,132 29% 2,720 71% 1,170 30% 2,794 70%<br />
3 312 20% 1,268 80% 378 21% 1,465 79% 425 21% 1,578 79%<br />
Total 6,209 33% 12,343 67% 7,443 35% 13,916 65% 8,245 35% 15,071 65%<br />
Fuente: elaboración propia con base en S.N.I. CONACYT (2012, 2013 y 2015).<br />
En la gráfica 7 se presentan los índices <strong>de</strong> equidad en la<br />
investigación, los índices <strong>de</strong> equidad género en la<br />
investigación, se <strong>de</strong>finieron como la razón <strong>de</strong> mujeres con<br />
respecto a hombres, el índice <strong>de</strong> igualdad va <strong>de</strong> 0 a 1<br />
don<strong>de</strong> 1 es la igualdad en la participación <strong>de</strong> hombres y<br />
mujeres y 0 es la <strong>de</strong>sigualdad. La gráfica se presenta<br />
clasificada por áreas <strong>de</strong> conocimiento y por el periodo<br />
analizado, se pue<strong>de</strong> observar que las áreas con mayor<br />
<strong>de</strong>sigualdad son las áreas 1 y 7 ya que son las áreas más<br />
alejadas <strong>de</strong> 1. El área con mayor igualdad es el área 4<br />
Humanida<strong>de</strong>s y Ciencias <strong>de</strong> la conducta, seguida <strong>de</strong>l área<br />
3 Medicina y Ciencias <strong>de</strong> la Salud y el área 2 Biología y<br />
INVESTIGACIÓN ADMINISTRATIVA AÑO: 44 NÚM. 116 ISSN: 1870-6614<br />
#116 / Año 44