Universidad de Carabobo Autoridades
vol23n32016
vol23n32016

Create successful ePaper yourself
Turn your PDF publications into a flip-book with our unique Google optimized e-Paper software.
Carlos Martínez y Guillermo Ramírez / Revista Ingeniería UC , Vol. 23, No. 3, Diciembre 2016, 280-289 287<br />
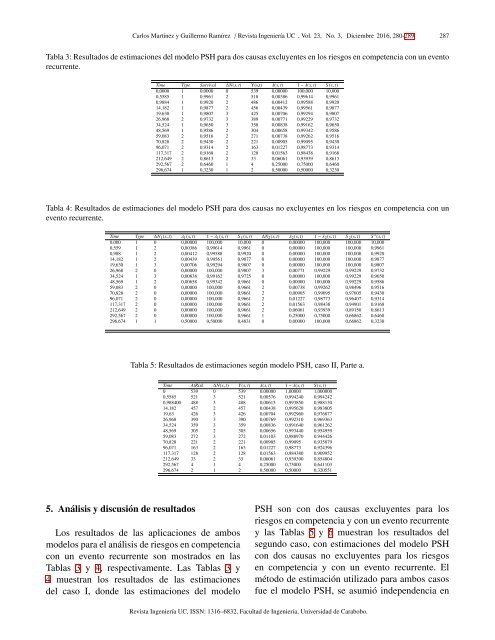
Tabla 3: Resultados <strong>de</strong> estimaciones <strong>de</strong>l mo<strong>de</strong>lo PSH para dos causas excluyentes en los riesgos en competencia con un evento<br />
recurrente.<br />
Time Type Survival ∆N(s, t) Y(s,t) λ(s, t) 1 − λ(s, t) S (s, t)<br />
0,0000 1 0,0000 0 539 0,00000 100,000 10,000<br />
0,5585 1 0,9961 2 518 0,00386 0,99614 0,9961<br />
0,9884 1 0,9920 2 486 0,00412 0,99588 0,9920<br />
14,182 1 0,9877 2 456 0,00439 0,99561 0,9877<br />
19,630 1 0,9807 3 425 0,00706 0,99294 0,9807<br />
26,968 2 0,9732 3 389 0,00771 0,99229 0,9732<br />
34,524 1 0,9650 3 358 0,00838 0,99162 0,9650<br />
48,569 1 0,9586 2 304 0,00658 0,99342 0,9586<br />
59,083 2 0,9516 2 271 0,00738 0,99262 0,9516<br />
70,828 2 0,9430 2 221 0,00905 0,99095 0,9430<br />
96,071 2 0,9314 2 163 0,01227 0,98773 0,9314<br />
117,317 2 0,9168 2 128 0,01563 0,98438 0,9168<br />
212,649 2 0,8613 2 33 0,06061 0,93939 0,8613<br />
292,567 2 0,6460 1 4 0,25000 0,75000 0,6460<br />
296,674 1 0,3230 1 2 0,50000 0,50000 0,3230<br />
Tabla 4: Resultados <strong>de</strong> estimaciones <strong>de</strong>l mo<strong>de</strong>lo PSH para dos causas no excluyentes en los riesgos en competencia con un<br />
evento recurrente.<br />
Time Type ∆N 1 (s, t) λ 1 (s, t) 1 − λ 1 (s, t) S 1 (s, t) ∆N 2 (s, t) λ 2 (s, t) 1 − λ 2 (s, t) S 2 (s, t) S ∗ (s, t)<br />
0,000 1 0 0,00000 100,000 10,000 0 0,00000 100,000 100,000 10,000<br />
0,559 1 2 0,00386 0,99614 0,9961 0 0,00000 100,000 100,000 0,9961<br />
0,988 1 2 0,00412 0,99588 0,9920 0 0,00000 100,000 100,000 0,9920<br />
14,182 1 2 0,00439 0,99561 0,9877 0 0,00000 100,000 100,000 0,9877<br />
19,630 1 3 0,00706 0,99294 0,9807 0 0,00000 100,000 100,000 0,9807<br />
26,968 2 0 0,00000 100,000 0,9807 3 0,00771 0,99229 0,99229 0,9732<br />
34,524 1 3 0,00838 0,99162 0,9725 0 0,00000 100,000 0,99229 0,9650<br />
48,569 1 2 0,00658 0,99342 0,9661 0 0,00000 100,000 0,99229 0,9586<br />
59,083 2 0 0,00000 100,000 0,9661 2 0,00738 0,99262 0,98496 0,9516<br />
70,828 2 0 0,00000 100,000 0,9661 2 0,00905 0,99095 0,97605 0,9430<br />
96,071 2 0 0,00000 100,000 0,9661 2 0,01227 0,98773 0,96407 0,9314<br />
117,317 2 0 0,00000 100,000 0,9661 2 0,01563 0,98438 0,94901 0,9168<br />
212,649 2 0 0,00000 100,000 0,9661 2 0,06061 0,93939 0,89150 0,8613<br />
292,567 2 0 0,00000 100,000 0,9661 1 0,25000 0,75000 0,66862 0,6460<br />
296,674 1 1 0,50000 0,50000 0,4831 0 0,00000 100,000 0,66862 0,3230<br />
Tabla 5: Resultados <strong>de</strong> estimaciones según mo<strong>de</strong>lo PSH, caso II, Parte a.<br />
Time AtRisk ∆N(s, t) Y(s, t) λ(s, t) 1 − λ(s, t) S (s, t)<br />
0 539 0 539 0,00000 1,00000 1,000000<br />
0,5585 521 3 521 0,00576 0,994240 0,994242<br />
0,988400 488 3 488 0,00615 0,993850 0,988130<br />
14,182 457 2 457 0,00438 0,995620 0,983805<br />
19,63 426 3 426 0,00704 0,992960 0,976877<br />
26,968 390 3 390 0,00769 0,992310 0,969363<br />
34,524 359 3 359 0,00836 0,991640 0,961262<br />
48,569 305 2 305 0,00656 0,993440 0,954959<br />
59,083 272 3 272 0,01103 0,988970 0,944426<br />
70,828 221 2 221 0,00905 0,99095 0,935879<br />
96,071 163 2 163 0,01227 0,98773 0,924396<br />
117,317 128 2 128 0,01563 0,984380 0,909952<br />
212,649 33 2 33 0,06061 0,939390 0,854804<br />
292,567 4 1 4 0,25000 0,75000 0,641103<br />
296,674 2 1 2 0,50000 0,50000 0,320551<br />
5. Análisis y discusión <strong>de</strong> resultados<br />
Los resultados <strong>de</strong> las aplicaciones <strong>de</strong> ambos<br />
mo<strong>de</strong>los para el análisis <strong>de</strong> riesgos en competencia<br />
con un evento recurrente son mostrados en las<br />
Tablas 3 y 4, respectivamente. Las Tablas 3 y<br />
4 muestran los resultados <strong>de</strong> las estimaciones<br />
<strong>de</strong>l caso I, don<strong>de</strong> las estimaciones <strong>de</strong>l mo<strong>de</strong>lo<br />
PSH son con dos causas excluyentes para los<br />
riesgos en competencia y con un evento recurrente<br />
y las Tablas 5 y 6 muestran los resultados <strong>de</strong>l<br />
segundo caso, con estimaciones <strong>de</strong>l mo<strong>de</strong>lo PSH<br />
con dos causas no excluyentes para los riesgos<br />
en competencia y con un evento recurrente. El<br />
método <strong>de</strong> estimación utilizado para ambos casos<br />
fue el mo<strong>de</strong>lo PSH, se asumió in<strong>de</strong>pen<strong>de</strong>ncia en<br />
Revista Ingeniería UC, ISSN: 1316–6832, Facultad <strong>de</strong> Ingeniería, <strong>Universidad</strong> <strong>de</strong> <strong>Carabobo</strong>.