

Informe de Gestion 2016

Create successful ePaper yourself
Turn your PDF publications into a flip-book with our unique Google optimized e-Paper software.
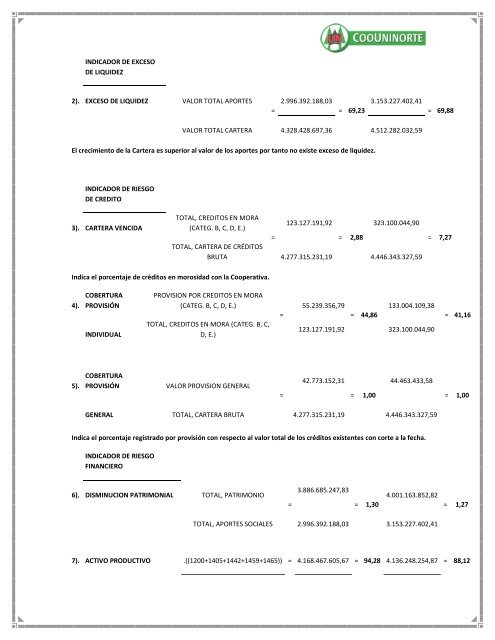
INDICADOR DE EXCESO<br />
DE LIQUIDEZ<br />
2). EXCESO DE LIQUIDEZ VALOR TOTAL APORTES<br />
=<br />
2.996.392.188,03<br />
= 69,23<br />
3.153.227.402,41<br />
= 69,88<br />
VALOR TOTAL CARTERA 4.328.428.697,36 4.512.282.032,59<br />
El crecimiento <strong>de</strong> la Cartera es superior al valor <strong>de</strong> los aportes por tanto no existe exceso <strong>de</strong> liqui<strong>de</strong>z.<br />
INDICADOR DE RIESGO<br />
DE CREDITO<br />
3). CARTERA VENCIDA<br />
TOTAL, CREDITOS EN MORA<br />
(CATEG. B, C, D, E.)<br />
123.127.191,92<br />
323.100.044,90<br />
=<br />
= 2,88<br />
TOTAL, CARTERA DE CRÉDITOS<br />
BRUTA 4.277.315.231,19 4.446.343.327,59<br />
= 7,27<br />
Indica el porcentaje <strong>de</strong> créditos en morosidad con la Cooperativa.<br />
4).<br />
COBERTURA<br />
PROVISIÓN<br />
INDIVIDUAL<br />
PROVISION POR CREDITOS EN MORA<br />
(CATEG. B, C, D, E.)<br />
TOTAL, CREDITOS EN MORA (CATEG. B, C,<br />
D, E.)<br />
=<br />
55.239.356,79<br />
133.004.109,38<br />
= 44,86<br />
123.127.191,92 323.100.044,90<br />
= 41,16<br />
5).<br />
COBERTURA<br />
PROVISIÓN<br />
VALOR PROVISION GENERAL<br />
=<br />
42.773.152,31<br />
= 1,00<br />
44.463.433,58<br />
= 1,00<br />
GENERAL TOTAL, CARTERA BRUTA 4.277.315.231,19 4.446.343.327,59<br />
Indica el porcentaje registrado por provisión con respecto al valor total <strong>de</strong> los créditos existentes con corte a la fecha.<br />
INDICADOR DE RIESGO<br />
FINANCIERO<br />
6). DISMINUCION PATRIMONIAL TOTAL, PATRIMONIO<br />
=<br />
3.886.685.247,83<br />
= 1,30<br />
4.001.163.852,82<br />
= 1,27<br />
TOTAL, APORTES SOCIALES 2.996.392.188,03 3.153.227.402,41<br />
7). ACTIVO PRODUCTIVO .((1200+1405+1442+1459+1465)) = 4.168.467.605,67 = 94,28 4.136.248.254,87 = 88,12


