Rapport complet en français (pdf - 5,88 Mo) - Total.com
Rapport complet en français (pdf - 5,88 Mo) - Total.com
Rapport complet en français (pdf - 5,88 Mo) - Total.com

Create successful ePaper yourself
Turn your PDF publications into a flip-book with our unique Google optimized e-Paper software.
4<br />
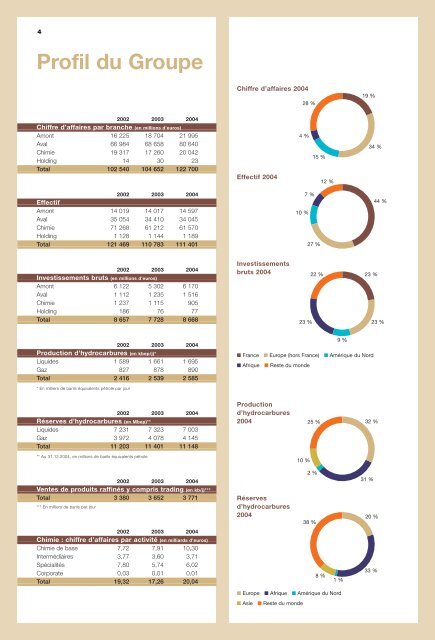
Profil du Groupe<br />
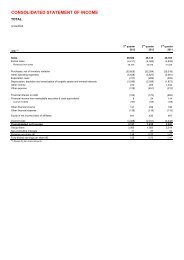
2002 2003 2004<br />
Chiffre d’affaires par branche (<strong>en</strong> millions d’euros)<br />
Amont 16 225 18 704 21 995<br />
Aval 66 984 68 658 80 640<br />
Chimie 19 317 17 260 20 042<br />
Holding 14 30 23<br />
<strong>Total</strong> 102 540 104 652 122 700<br />
2002 2003 2004<br />
Effectif<br />
Amont 14 019 14 017 14 597<br />
Aval 35 054 34 410 34 045<br />
Chimie 71 268 61 212 61 570<br />
Holding 1 128 1 144 1 189<br />
<strong>Total</strong> 121 469 110 783 111 401<br />
2002 2003 2004<br />
Investissem<strong>en</strong>ts bruts (<strong>en</strong> millions d’euros)<br />
Amont 6 122 5 302 6 170<br />
Aval 1 112 1 235 1 516<br />
Chimie 1 237 1 115 905<br />
Holding 186 76 77<br />
<strong>Total</strong> 8 657 7 728 8 668<br />
2002 2003 2004<br />
Production d’hydrocarbures (<strong>en</strong> kbep/j)*<br />
Liquides 1 589 1 661 1 695<br />
Gaz 827 878 890<br />
<strong>Total</strong> 2 416 2 539 2 585<br />
* En milliers de barils équival<strong>en</strong>ts pétrole par jour<br />
2002 2003 2004<br />
Réserves d’hydrocarbures (<strong>en</strong> Mbep)**<br />
Liquides 7 231 7 323 7 003<br />
Gaz 3 972 4 078 4 145<br />
<strong>Total</strong> 11 203 11 401 11 148<br />
** Au 31.12.2004, <strong>en</strong> millions de barils équival<strong>en</strong>ts pétrole<br />
2002 2003 2004<br />
V<strong>en</strong>tes de produits raffinés y <strong>com</strong>pris trading (<strong>en</strong> kb/j)***<br />
<strong>Total</strong> 3 380 3 652 3 771<br />
*** En milliers de barils par jour<br />
2002 2003 2004<br />
Chimie : chiffre d’affaires par activité (<strong>en</strong> milliards d’euros)<br />
Chimie de base 7,72 7,91 10,30<br />
Intermédiaires 3,77 3,60 3,71<br />
Spécialités 7,80 5,74 6,02<br />
Corporate 0,03 0,01 0,01<br />
<strong>Total</strong> 19,32 17,26 20,04<br />
Chiffre d’affaires 2004<br />
Effectif 2004<br />
Investissem<strong>en</strong>ts<br />
bruts 2004<br />
■ France ■ Europe (hors France) ■ Amérique du Nord<br />
■ Afrique ■ Reste du monde<br />
Production<br />
d’hydrocarbures<br />
2004<br />
Réserves<br />
d’hydrocarbures<br />
2004<br />
■ Europe ■ Afrique ■ Amérique du Nord<br />
■ Asie ■ Reste du monde<br />
28 %<br />
4 %<br />
10 %<br />
7 %<br />
10 %<br />
15 %<br />
27 %<br />
38 %<br />
22 %<br />
2 %<br />
8 %<br />
12 %<br />
9 %<br />
1 %<br />
19 %<br />
31 %<br />
34 %<br />
23 %<br />
25 % 32 %<br />
20 %<br />
33 %<br />
44 %<br />
23 % 23 %