Paysages virtuels et analyse de scénarios pour évaluer les impacts ...
Paysages virtuels et analyse de scénarios pour évaluer les impacts ...
Paysages virtuels et analyse de scénarios pour évaluer les impacts ...

Create successful ePaper yourself
Turn your PDF publications into a flip-book with our unique Google optimized e-Paper software.
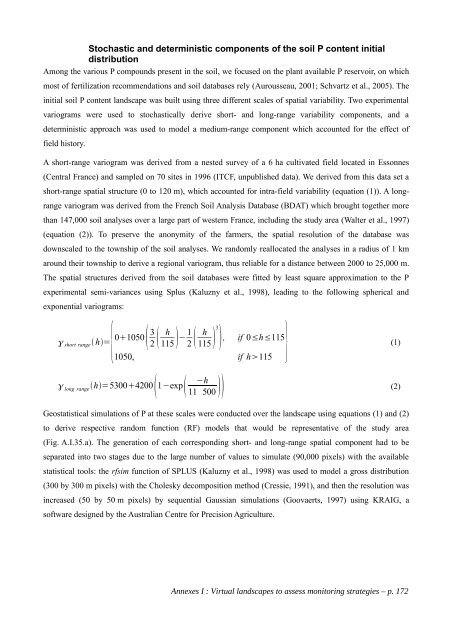
Stochastic and d<strong>et</strong>erministic components of the soil P content initial<br />
distribution<br />
Among the various P compounds present in the soil, we focused on the plant available P reservoir, on which<br />
most of fertilization recommendations and soil databases rely (Aurousseau, 2001; Schvartz <strong>et</strong> al., 2005). The<br />
initial soil P content landscape was built using three different sca<strong>les</strong> of spatial variability. Two experimental<br />
variograms were used to stochastically <strong>de</strong>rive short- and long-range variability components, and a<br />
d<strong>et</strong>erministic approach was used to mo<strong>de</strong>l a medium-range component which accounted for the effect of<br />
field history.<br />
A short-range variogram was <strong>de</strong>rived from a nested survey of a 6 ha cultivated field located in Essonnes<br />
(Central France) and sampled on 70 sites in 1996 (ITCF, unpublished data). We <strong>de</strong>rived from this data s<strong>et</strong> a<br />
short-range spatial structure (0 to 120 m), which accounted for intra-field variability (equation (1)). A long-<br />
range variogram was <strong>de</strong>rived from the French Soil Analysis Database (BDAT) which brought tog<strong>et</strong>her more<br />
than 147,000 soil <strong>analyse</strong>s over a large part of western France, including the study area (Walter <strong>et</strong> al., 1997)<br />
(equation (2)). To preserve the anonymity of the farmers, the spatial resolution of the database was<br />
downscaled to the township of the soil <strong>analyse</strong>s. We randomly reallocated the <strong>analyse</strong>s in a radius of 1 km<br />
around their township to <strong>de</strong>rive a regional variogram, thus reliable for a distance b<strong>et</strong>ween 2000 to 25,000 m.<br />
The spatial structures <strong>de</strong>rived from the soil databases were fitted by least square approximation to the P<br />
experimental semi-variances using Splus (Kaluzny <strong>et</strong> al., 1998), leading to the following spherical and<br />
exponential variograms:<br />
short range h={01050 3<br />
2 h 1<br />
115 − 2 h<br />
3<br />
115 } , if 0≤h≤115<br />
(1)<br />
1050, if h115<br />
−h<br />
long rangeh=53004200 1−exp 11 500 <br />
Geostatistical simulations of P at these sca<strong>les</strong> were conducted over the landscape using equations (1) and (2)<br />
to <strong>de</strong>rive respective random function (RF) mo<strong>de</strong>ls that would be representative of the study area<br />
(Fig. A.I.35.a). The generation of each corresponding short- and long-range spatial component had to be<br />
separated into two stages due to the large number of values to simulate (90,000 pixels) with the available<br />
statistical tools: the rfsim function of SPLUS (Kaluzny <strong>et</strong> al., 1998) was used to mo<strong>de</strong>l a gross distribution<br />
(300 by 300 m pixels) with the Cho<strong>les</strong>ky <strong>de</strong>composition m<strong>et</strong>hod (Cressie, 1991), and then the resolution was<br />
increased (50 by 50 m pixels) by sequential Gaussian simulations (Goovaerts, 1997) using KRAIG, a<br />
software <strong>de</strong>signed by the Australian Centre for Precision Agriculture.<br />
Annexes I : Virtual landscapes to assess monitoring strategies – p. 172<br />
(2)