Paysages virtuels et analyse de scénarios pour évaluer les impacts ...
Paysages virtuels et analyse de scénarios pour évaluer les impacts ...
Paysages virtuels et analyse de scénarios pour évaluer les impacts ...
You also want an ePaper? Increase the reach of your titles
YUMPU automatically turns print PDFs into web optimized ePapers that Google loves.
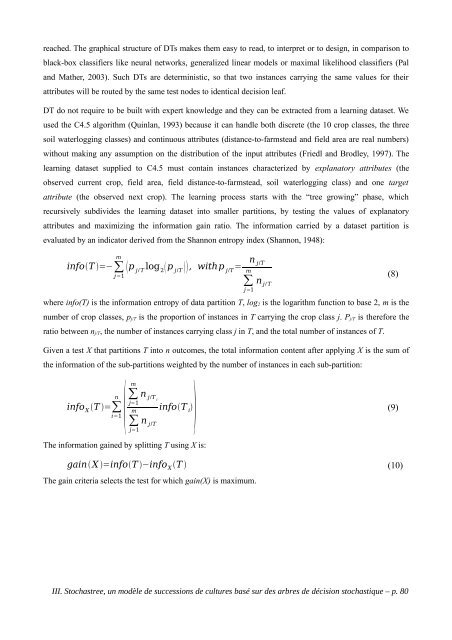
eached. The graphical structure of DTs makes them easy to read, to interpr<strong>et</strong> or to <strong>de</strong>sign, in comparison to<br />
black-box classifiers like neural n<strong>et</strong>works, generalized linear mo<strong>de</strong>ls or maximal likelihood classifiers (Pal<br />
and Mather, 2003). Such DTs are d<strong>et</strong>erministic, so that two instances carrying the same values for their<br />
attributes will be routed by the same test no<strong>de</strong>s to i<strong>de</strong>ntical <strong>de</strong>cision leaf.<br />
DT do not require to be built with expert knowledge and they can be extracted from a learning datas<strong>et</strong>. We<br />
used the C4.5 algorithm (Quinlan, 1993) because it can handle both discr<strong>et</strong>e (the 10 crop classes, the three<br />
soil waterlogging classes) and continuous attributes (distance-to-farmstead and field area are real numbers)<br />
without making any assumption on the distribution of the input attributes (Friedl and Brodley, 1997). The<br />
learning datas<strong>et</strong> supplied to C4.5 must contain instances characterized by explanatory attributes (the<br />
observed current crop, field area, field distance-to-farmstead, soil waterlogging class) and one targ<strong>et</strong><br />
attribute (the observed next crop). The learning process starts with the “tree growing” phase, which<br />
recursively subdivi<strong>de</strong>s the learning datas<strong>et</strong> into smaller partitions, by testing the values of explanatory<br />
attributes and maximizing the information gain ratio. The information carried by a datas<strong>et</strong> partition is<br />
evaluated by an indicator <strong>de</strong>rived from the Shannon entropy in<strong>de</strong>x (Shannon, 1948):<br />
m<br />
infoT =−∑ p log j/ T 2 p j/T , withp = j/T<br />
j=1<br />
n j/T<br />
m<br />
where info(T) is the information entropy of data partition T, log2 is the logarithm function to base 2, m is the<br />
number of crop classes, pj/T is the proportion of instances in T carrying the crop class j. Pj/T is therefore the<br />
ratio b<strong>et</strong>ween nj/T, the number of instances carrying class j in T, and the total number of instances of T.<br />
Given a test X that partitions T into n outcomes, the total information content after applying X is the sum of<br />
the information of the sub-partitions weighted by the number of instances in each sub-partition:<br />
<br />
m<br />
n ∑ n j/T i<br />
j=1<br />
infoX T =∑ infoT i<br />
i=1<br />
m<br />
∑ n j/T<br />
j=1<br />
The information gained by splitting T using X is:<br />
gain X =infoT −info X T (10)<br />
∑ j=1<br />
The gain criteria selects the test for which gain(X) is maximum.<br />
III. Stochastree, un modèle <strong>de</strong> successions <strong>de</strong> cultures basé sur <strong>de</strong>s arbres <strong>de</strong> décision stochastique – p. 80<br />
n j/ T<br />
(8)<br />
(9)


