Télécharger le manuel de l'utilisateur - IRDA
Télécharger le manuel de l'utilisateur - IRDA
Télécharger le manuel de l'utilisateur - IRDA

You also want an ePaper? Increase the reach of your titles
YUMPU automatically turns print PDFs into web optimized ePapers that Google loves.
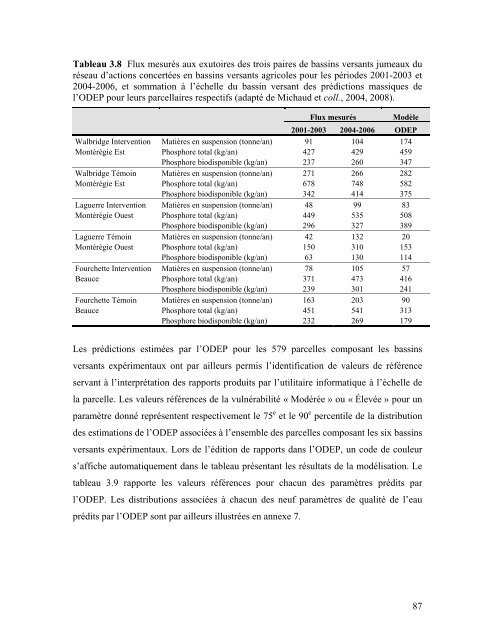
Tab<strong>le</strong>au 3.8 Flux mesurés aux exutoires <strong>de</strong>s trois paires <strong>de</strong> bassins versants jumeaux du<br />
réseau d’actions concertées en bassins versants agrico<strong>le</strong>s pour <strong>le</strong>s pério<strong>de</strong>s 2001-2003 et<br />
2004-2006, et sommation à l’échel<strong>le</strong> du bassin versant <strong>de</strong>s prédictions massiques <strong>de</strong><br />
l’ODEP pour <strong>le</strong>urs parcellaires respectifs (adapté <strong>de</strong> Michaud et coll., 2004, 2008).<br />
Flux mesurés Modè<strong>le</strong><br />
2001-2003 2004-2006 ODEP<br />
Walbridge Intervention Matières en suspension (tonne/an) 91 104 174<br />
Montérégie Est Phosphore total (kg/an) 427 429 459<br />
Phosphore biodisponib<strong>le</strong> (kg/an) 237 260 347<br />
Walbridge Témoin Matières en suspension (tonne/an) 271 266 282<br />
Montérégie Est Phosphore total (kg/an) 678 748 582<br />
Phosphore biodisponib<strong>le</strong> (kg/an) 342 414 375<br />
Laguerre Intervention Matières en suspension (tonne/an) 48 99 83<br />
Montérégie Ouest Phosphore total (kg/an) 449 535 508<br />
Phosphore biodisponib<strong>le</strong> (kg/an) 296 327 389<br />
Laguerre Témoin Matières en suspension (tonne/an) 42 132 20<br />
Montérégie Ouest Phosphore total (kg/an) 150 310 153<br />
Phosphore biodisponib<strong>le</strong> (kg/an) 63 130 114<br />
Fourchette Intervention Matières en suspension (tonne/an) 78 105 57<br />
Beauce Phosphore total (kg/an) 371 473 416<br />
Phosphore biodisponib<strong>le</strong> (kg/an) 239 301 241<br />
Fourchette Témoin Matières en suspension (tonne/an) 163 203 90<br />
Beauce Phosphore total (kg/an) 451 541 313<br />
Phosphore biodisponib<strong>le</strong> (kg/an) 232 269 179<br />
Les prédictions estimées par l’ODEP pour <strong>le</strong>s 579 parcel<strong>le</strong>s composant <strong>le</strong>s bassins<br />
versants expérimentaux ont par ail<strong>le</strong>urs permis l’i<strong>de</strong>ntification <strong>de</strong> va<strong>le</strong>urs <strong>de</strong> référence<br />
servant à l’interprétation <strong>de</strong>s rapports produits par l’utilitaire informatique à l’échel<strong>le</strong> <strong>de</strong><br />
la parcel<strong>le</strong>. Les va<strong>le</strong>urs références <strong>de</strong> la vulnérabilité « Modérée » ou « É<strong>le</strong>vée » pour un<br />
paramètre donné représentent respectivement <strong>le</strong> 75 e et <strong>le</strong> 90 e percenti<strong>le</strong> <strong>de</strong> la distribution<br />
<strong>de</strong>s estimations <strong>de</strong> l’ODEP associées à l’ensemb<strong>le</strong> <strong>de</strong>s parcel<strong>le</strong>s composant <strong>le</strong>s six bassins<br />
versants expérimentaux. Lors <strong>de</strong> l’édition <strong>de</strong> rapports dans l’ODEP, un co<strong>de</strong> <strong>de</strong> cou<strong>le</strong>ur<br />
s’affiche automatiquement dans <strong>le</strong> tab<strong>le</strong>au présentant <strong>le</strong>s résultats <strong>de</strong> la modélisation. Le<br />
tab<strong>le</strong>au 3.9 rapporte <strong>le</strong>s va<strong>le</strong>urs références pour chacun <strong>de</strong>s paramètres prédits par<br />
l’ODEP. Les distributions associées à chacun <strong>de</strong>s neuf paramètres <strong>de</strong> qualité <strong>de</strong> l’eau<br />
prédits par l’ODEP sont par ail<strong>le</strong>urs illustrées en annexe 7.<br />
87