Rapport d'activité FUS 2012 - Schweizer Obstverband
Rapport d'activité FUS 2012 - Schweizer Obstverband
Rapport d'activité FUS 2012 - Schweizer Obstverband

You also want an ePaper? Increase the reach of your titles
YUMPU automatically turns print PDFs into web optimized ePapers that Google loves.
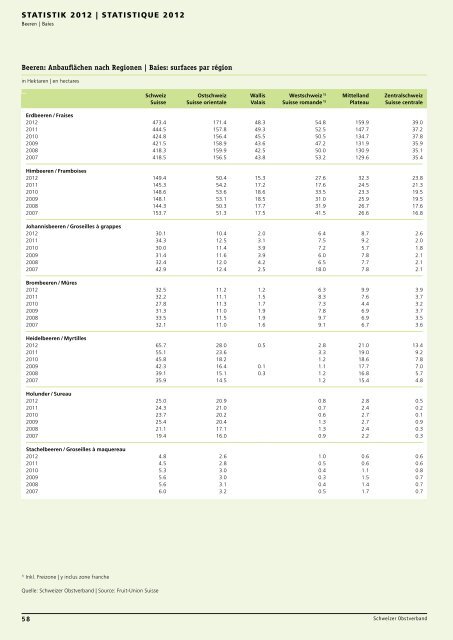
Statistik <strong>2012</strong> | Statistique <strong>2012</strong><br />
Beeren | Baies<br />
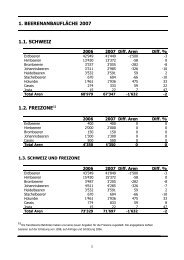
Beeren: Anbauflächen nach Regionen | Baies: surfaces par région<br />
in Hektaren | en hectares<br />
Schweiz<br />
Suisse<br />
Ostschweiz<br />
Suisse orientale<br />
Wallis<br />
Valais<br />
Westschweiz 1)<br />
Suisse romande 1)<br />
Mittelland<br />
Plateau<br />
Zentralschweiz<br />
Suisse centrale<br />
Erdbeeren / Fraises<br />
<strong>2012</strong> 473.4 171.4 48.3 54.8 159.9 39.0<br />
2011 444.5 157.8 49.3 52.5 147.7 37.2<br />
2010 424.8 156.4 45.5 50.5 134.7 37.8<br />
2009 421.5 158.9 43.6 47.2 131.9 35.9<br />
2008 418.3 159.9 42.5 50.0 130.9 35.1<br />
2007 418.5 156.5 43.8 53.2 129.6 35.4<br />
Himbeeren / Framboises<br />
<strong>2012</strong> 149.4 50.4 15.3 27.6 32.3 23.8<br />
2011 145.3 54.2 17.2 17.6 24.5 21.3<br />
2010 148.6 53.6 18.6 33.5 23.3 19.5<br />
2009 148.1 53.1 18.5 31.0 25.9 19.5<br />
2008 144.3 50.3 17.7 31.9 26.7 17.6<br />
2007 153.7 51.3 17.5 41.5 26.6 16.8<br />
Johannisbeeren / Groseilles à grappes<br />
<strong>2012</strong> 30.1 10.4 2.0 6.4 8.7 2.6<br />
2011 34.3 12.5 3.1 7.5 9.2 2.0<br />
2010 30.0 11.4 3.9 7.2 5.7 1.8<br />
2009 31.4 11.6 3.9 6.0 7.8 2.1<br />
2008 32.4 12.0 4.2 6.5 7.7 2.1<br />
2007 42.9 12.4 2.5 18.0 7.8 2.1<br />
Brombeeren / Mûres<br />
<strong>2012</strong> 32.5 11.2 1.2 6.3 9.9 3.9<br />
2011 32.2 11.1 1.5 8.3 7.6 3.7<br />
2010 27.8 11.3 1.7 7.3 4.4 3.2<br />
2009 31.3 11.0 1.9 7.8 6.9 3.7<br />
2008 33.5 11.5 1.9 9.7 6.9 3.5<br />
2007 32.1 11.0 1.6 9.1 6.7 3.6<br />
Heidelbeeren / Myrtilles<br />
<strong>2012</strong> 65.7 28.0 0.5 2.8 21.0 13.4<br />
2011 55.1 23.6 3.3 19.0 9.2<br />
2010 45.8 18.2 1.2 18.6 7.8<br />
2009 42.3 16.4 0.1 1.1 17.7 7.0<br />
2008 39.1 15.1 0.3 1.2 16.8 5.7<br />
2007 35.9 14.5 1.2 15.4 4.8<br />
Holunder / Sureau<br />
<strong>2012</strong> 25.0 20.9 0.8 2.8 0.5<br />
2011 24.3 21.0 0.7 2.4 0.2<br />
2010 23.7 20.2 0.6 2.7 0.1<br />
2009 25.4 20.4 1.3 2.7 0.9<br />
2008 21.1 17.1 1.3 2.4 0.3<br />
2007 19.4 16.0 0.9 2.2 0.3<br />
Stachelbeeren / Groseilles à maquereau<br />
<strong>2012</strong> 4.8 2.6 1.0 0.6 0.6<br />
2011 4.5 2.8 0.5 0.6 0.6<br />
2010 5.3 3.0 0.4 1.1 0.8<br />
2009 5.6 3.0 0.3 1.5 0.7<br />
2008 5.6 3.1 0.4 1.4 0.7<br />
2007 6.0 3.2 0.5 1.7 0.7<br />
1)<br />
Inkl. Freizone | y inclus zone franche<br />
Quelle: <strong>Schweizer</strong> <strong>Obstverband</strong> | Source: Fruit-Union Suisse<br />
58 <strong>Schweizer</strong> <strong>Obstverband</strong>