Lien externe ou de téléchargement - Slire
Lien externe ou de téléchargement - Slire
Lien externe ou de téléchargement - Slire
- No tags were found...

You also want an ePaper? Increase the reach of your titles
YUMPU automatically turns print PDFs into web optimized ePapers that Google loves.
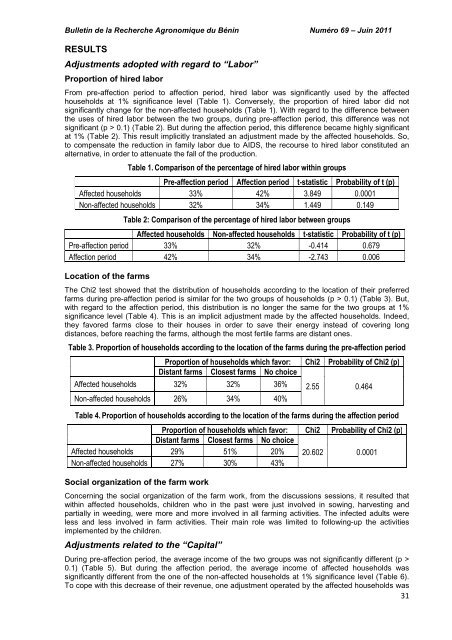
Bulletin <strong>de</strong> la Recherche Agronomique du Bénin Numéro 69 – Juin 2011RESULTSAdjustments adopted with regard to “Labor”Proportion of hired laborFrom pre-affection period to affection period, hired labor was significantly used by the affectedh<strong>ou</strong>seholds at 1% significance level (Table 1). Conversely, the proportion of hired labor did notsignificantly change for the non-affected h<strong>ou</strong>seholds (Table 1). With regard to the difference betweenthe uses of hired labor between the two gr<strong>ou</strong>ps, during pre-affection period, this difference was notsignificant (p > 0.1) (Table 2). But during the affection period, this difference became highly significantat 1% (Table 2). This result implicitly translated an adjustment ma<strong>de</strong> by the affected h<strong>ou</strong>seholds. So,to compensate the reduction in family labor due to AIDS, the rec<strong>ou</strong>rse to hired labor constituted analternative, in or<strong>de</strong>r to attenuate the fall of the production.Table 1. Comparison of the percentage of hired labor within gr<strong>ou</strong>psPre-affection period Affection period t-statistic Probability of t (p)Affected h<strong>ou</strong>seholds 33% 42% 3.849 0.0001Non-affected h<strong>ou</strong>seholds 32% 34% 1.449 0.149Table 2: Comparison of the percentage of hired labor between gr<strong>ou</strong>psAffected h<strong>ou</strong>seholds Non-affected h<strong>ou</strong>seholds t-statistic Probability of t (p)Pre-affection period 33% 32% -0.414 0.679Affection period 42% 34% -2.743 0.006Location of the farmsThe Chi2 test showed that the distribution of h<strong>ou</strong>seholds according to the location of their preferredfarms during pre-affection period is similar for the two gr<strong>ou</strong>ps of h<strong>ou</strong>seholds (p > 0.1) (Table 3). But,with regard to the affection period, this distribution is no longer the same for the two gr<strong>ou</strong>ps at 1%significance level (Table 4). This is an implicit adjustment ma<strong>de</strong> by the affected h<strong>ou</strong>seholds. In<strong>de</strong>ed,they favored farms close to their h<strong>ou</strong>ses in or<strong>de</strong>r to save their energy instead of covering longdistances, before reaching the farms, alth<strong>ou</strong>gh the most fertile farms are distant ones.Table 3. Proportion of h<strong>ou</strong>seholds according to the location of the farms during the pre-affection periodProportion of h<strong>ou</strong>seholds which favor: Chi2 Probability of Chi2 (p)Distant farms Closest farms No choiceAffected h<strong>ou</strong>seholds 32% 32% 36%Non-affected h<strong>ou</strong>seholds 26% 34% 40%2.55 0.464Table 4. Proportion of h<strong>ou</strong>seholds according to the location of the farms during the affection periodProportion of h<strong>ou</strong>seholds which favor: Chi2 Probability of Chi2 (p)Distant farms Closest farms No choiceAffected h<strong>ou</strong>seholds 29% 51% 20% 20.602 0.0001Non-affected h<strong>ou</strong>seholds 27% 30% 43%Social organization of the farm workConcerning the social organization of the farm work, from the discussions sessions, it resulted thatwithin affected h<strong>ou</strong>seholds, children who in the past were just involved in sowing, harvesting andpartially in weeding, were more and more involved in all farming activities. The infected adults wereless and less involved in farm activities. Their main role was limited to following-up the activitiesimplemented by the children.Adjustments related to the “Capital”During pre-affection period, the average income of the two gr<strong>ou</strong>ps was not significantly different (p >0.1) (Table 5). But during the affection period, the average income of affected h<strong>ou</strong>seholds wassignificantly different from the one of the non-affected h<strong>ou</strong>seholds at 1% significance level (Table 6).To cope with this <strong>de</strong>crease of their revenue, one adjustment operated by the affected h<strong>ou</strong>seholds was31