Report annuale 2007 Regione Emilia - RIPO - Cineca
Report annuale 2007 Regione Emilia - RIPO - Cineca
Report annuale 2007 Regione Emilia - RIPO - Cineca

You also want an ePaper? Increase the reach of your titles
YUMPU automatically turns print PDFs into web optimized ePapers that Google loves.
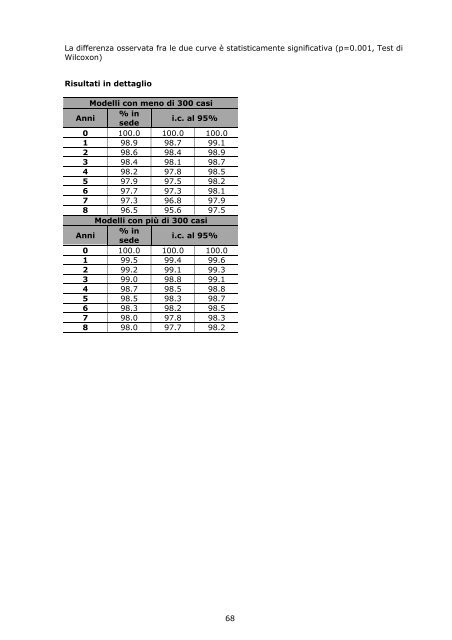
La differenza osservata fra le due curve è statisticamente significativa (p=0.001, Test diWilcoxon)Risultati in dettaglioModelli con meno di 300 casiAnni% insedei.c. al 95%0 100.0 100.0 100.01 98.9 98.7 99.12 98.6 98.4 98.93 98.4 98.1 98.74 98.2 97.8 98.55 97.9 97.5 98.26 97.7 97.3 98.17 97.3 96.8 97.98 96.5 95.6 97.5Modelli con più di 300 casiAnni% insedei.c. al 95%0 100.0 100.0 100.01 99.5 99.4 99.62 99.2 99.1 99.33 99.0 98.8 99.14 98.7 98.5 98.85 98.5 98.3 98.76 98.3 98.2 98.57 98.0 97.8 98.38 98.0 97.7 98.268