Report annuale 2007 Regione Emilia - RIPO - Cineca
Report annuale 2007 Regione Emilia - RIPO - Cineca
Report annuale 2007 Regione Emilia - RIPO - Cineca

Create successful ePaper yourself
Turn your PDF publications into a flip-book with our unique Google optimized e-Paper software.
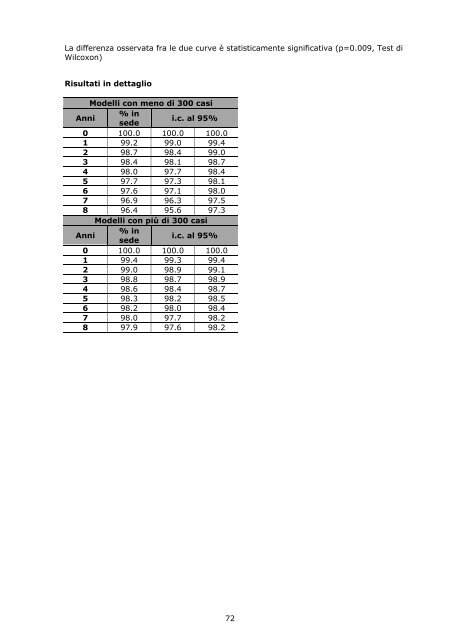
La differenza osservata fra le due curve è statisticamente significativa (p=0.009, Test diWilcoxon)Risultati in dettaglioModelli con meno di 300 casiAnni% insedei.c. al 95%0 100.0 100.0 100.01 99.2 99.0 99.42 98.7 98.4 99.03 98.4 98.1 98.74 98.0 97.7 98.45 97.7 97.3 98.16 97.6 97.1 98.07 96.9 96.3 97.58 96.4 95.6 97.3Modelli con più di 300 casiAnni% insedei.c. al 95%0 100.0 100.0 100.01 99.4 99.3 99.42 99.0 98.9 99.13 98.8 98.7 98.94 98.6 98.4 98.75 98.3 98.2 98.56 98.2 98.0 98.47 98.0 97.7 98.28 97.9 97.6 98.272