Boletim Epi<strong>de</strong>miológico ANO XXV – Nº 1 Tabela 24 - Municípios com taxas <strong>de</strong> mortalida<strong>de</strong> (TM)* por AIDS em 2007 maior que a do Estado segundo a<strong>no</strong> <strong>de</strong> ocorrência, Estado <strong>de</strong> São Paulo, 1990 a 2007 (entre os 150 municípios com maior nº <strong>de</strong> óbitos <strong>de</strong> 1990 a 2007) Município A<strong>no</strong> <strong>de</strong> Ocorrência Total 1990 a 2007 1990 1995 2000 2001 2002 2003 2004 2005 2006 2007 TM TM TM TM TM TM TM TM TM TM nº % Estado <strong>de</strong> São Paulo 10,1 22,9 11,3 10,6 10,1 9,4 8,5 8,8 8,4 8,0 84.319 100,0 1 Aparecida - 11,7 22,9 22,8 11,3 22,4 11,1 24,8 5,5 24,5 103 0,1 2 Catanduva 7,7 60,5 24,6 30,0 28,9 10,2 20,2 20,9 16,3 24,2 492 0,6 3 Mirandópolis 8,3 - 11,6 11,5 11,4 - 7,5 3,7 14,8 22,2 60 0,1 4 Monte Alto 7,7 21,7 18,4 15,9 15,8 8,9 8,8 13,2 8,7 21,6 112 0,1 5 Bebedouro 6,1 54,9 29,4 34,6 25,1 18,4 17,0 10,4 18,2 20,7 391 0,5 6 Lorena 5,6 16,2 20,5 17,8 12,6 13,7 11,1 19,6 14,6 20,5 211 0,3 7 Bertioga - 10,6 10,1 12,8 15,2 14,5 11,0 5,2 - 19,4 53 0,1 8 Cruzeiro 5,9 15,5 23,1 25,7 45,5 23,9 17,1 28,8 20,8 19,3 254 0,3 9 Guariba - 16,7 12,9 12,8 9,5 6,3 3,1 3,1 12,2 18,2 48 0,1 10 Franco da Rocha 17,3 32,8 10,2 9,1 4,4 14,8 13,6 10,0 9,8 17,7 304 0,4 11 Barretos 11,8 36,2 33,7 31,6 30,4 34,9 24,4 24,2 20,4 17,5 541 0,6 12 Santos 38,8 65,2 28,5 27,4 18,5 21,0 13,9 15,7 15,9 16,8 2.799 3,3 13 Araras 1,2 22,1 12,5 19,0 16,8 15,7 15,5 13,4 9,7 16,6 247 0,3 14 São Vicente 16,9 39,9 24,7 18,6 12,6 14,7 12,0 21,0 12,7 16,6 1.164 1,4 15 Jaboticabal 5,2 42,9 23,8 17,6 14,5 15,8 12,7 16,8 6,9 16,5 227 0,3 16 Votuporanga 6,2 20,1 2,6 7,8 12,9 7,6 12,6 8,7 8,6 15,8 159 0,2 17 Araraquara 6,2 37,1 22,5 21,1 21,4 10,6 15,2 13,4 14,3 15,2 718 0,9 18 Caraguatatuba 2,0 17,2 6,4 15,0 11,0 1,2 12,9 10,3 5,7 14,6 142 0,2 19 Bauru 7,5 40,1 16,5 15,0 17,2 16,0 13,6 16,3 13,8 14,5 1.022 1,2 20 Ribeirão Preto 21,3 57,5 25,2 22,9 20,2 15,2 17,8 17,9 14,7 14,4 2.594 3,1 21 Taquaritinga - 20,4 25,0 30,4 15,0 24,2 9,2 16,4 10,8 14,3 169 0,2 22 Vinhedo - 10,2 2,1 12,4 8,0 9,7 7,5 5,5 5,3 13,9 60 0,1 23 Araçatuba 2,6 31,2 13,6 12,3 13,9 12,1 11,4 11,9 14,6 13,4 463 0,5 24 Taubaté 8,4 40,9 19,3 16,6 14,3 15,7 14,7 16,0 13,2 13,4 882 1,0 25 Itapira - 18,4 19,0 23,4 17,0 16,7 28,6 16,3 13,2 13,1 199 0,2 26 Serrana - 18,5 9,2 6,0 2,9 - 2,8 2,7 10,6 13,0 48 0,1 27 São Caeta<strong>no</strong> do Sul 13,9 33,5 12,8 17,0 9,9 14,0 7,6 12,4 9,6 13,0 492 0,6 28 São José do Rio Preto 24,7 56,0 24,9 17,8 18,3 16,1 18,6 16,7 14,5 12,8 1.756 2,1 29 Ubatuba 2,2 7,2 12,0 13,1 17,0 6,9 13,4 10,4 8,9 12,4 146 0,2 30 Praia Gran<strong>de</strong> 10,4 34,1 10,9 7,0 10,2 9,0 7,3 10,2 10,3 12,2 471 0,6 31 São Carlos 5,2 17,9 16,1 13,7 12,5 9,3 6,2 7,0 15,3 11,8 425 0,5 32 Assis 1,2 18,6 6,9 14,7 6,7 10,0 12,0 6,5 5,4 11,7 175 0,2 33 Mirassol 2,6 25,4 10,4 10,2 6,0 27,8 17,6 11,6 11,5 11,3 129 0,2 34 Leme 1,5 13,6 9,9 11,0 15,7 11,9 7,1 11,6 9,2 11,3 181 0,2 35 Caçapava 12,5 58,4 38,1 33,8 33,4 31,7 21,3 16,1 14,7 10,9 385 0,5 36 Guaíra - 15,4 11,6 2,9 2,8 8,4 5,6 5,5 - 10,9 38 0,0 37 Cubatão 12,3 24,5 19,4 11,8 8,9 14,1 8,7 11,1 14,3 10,8 348 0,4 38 Piracicaba 4,7 23,4 21,3 18,3 14,8 16,3 10,9 10,4 12,8 10,5 908 1,1 39 Ituverava 3,1 29,0 8,3 5,5 16,2 16,0 5,3 5,2 - 10,3 61 0,1 40 Olímpia - 6,7 8,7 8,6 4,3 8,5 2,1 4,2 10,3 10,3 56 0,1 41 Moji Mirim 6,3 19,4 9,8 7,3 10,7 15,3 1,2 12,5 11,2 10,0 150 0,2 42 Guarujá 16,8 42,1 18,9 17,4 20,0 13,5 11,9 13,7 10,8 9,9 993 1,2 43 Presi<strong>de</strong>nte Pru<strong>de</strong>nte 4,3 23,3 14,3 15,2 15,0 7,2 7,6 7,0 6,9 9,8 420 0,5 44 Itu 3,9 31,1 18,5 14,5 16,4 7,7 14,4 4,0 12,6 9,8 318 0,4 45 Ourinhos 5,3 7,1 9,6 20,0 10,4 16,4 9,1 18,9 8,8 9,7 183 0,2 46 Taboão da Serra 7,9 18,5 6,1 9,9 9,7 6,6 8,4 10,0 8,0 9,6 403 0,5 47 Rio Claro 7,4 24,5 13,7 8,2 9,2 9,6 9,4 7,6 8,1 9,5 362 0,4 48 Francisco Morato 8,0 16,4 12,0 8,8 14,3 6,3 12,9 11,2 6,5 9,5 245 0,3 49 Sertãozinho 4,0 15,2 16,9 8,3 7,2 16,1 4,0 11,7 13,4 9,5 193 0,2 50 Cosmópolis 2,9 20,7 9,0 4,4 6,4 4,1 10,1 9,8 3,8 9,3 74 0,1 51 Pirajuí - 35,9 14,9 14,7 24,3 4,8 4,7 9,3 27,9 9,2 57 0,1 52 Mongaguá 22,6 11,7 11,5 8,3 16,1 23,3 17,5 16,9 11,8 9,2 95 0,1 53 Itanhaém 2,3 14,1 11,2 8,1 1,3 10,1 3,7 11,9 12,8 9,1 103 0,1 54 Tupã 1,6 1,6 9,5 6,3 7,8 4,6 7,7 7,6 16,7 9,1 65 0,1 55 Limeira 4,0 17,3 10,9 11,5 10,1 10,4 8,3 7,4 5,1 9,1 461 0,5 56 Peruíbe 19,3 12,4 5,9 9,6 11,4 18,8 7,4 22,0 14,6 9,1 104 0,1 57 Batatais 4,6 6,3 13,7 13,5 7,6 9,4 5,6 9,2 5,5 9,0 84 0,1 58 Monte Mor 4,2 6,6 8,1 5,2 2,5 - 14,4 2,3 4,6 9,0 42 0,0 59 Indaiatuba - 8,3 8,2 7,9 2,6 4,4 4,2 2,9 4,6 8,9 115 0,1 60 São Paulo 17,5 31,7 13,2 11,9 11,5 10,7 9,5 9,5 9,9 8,8 32.276 38,3 61 São Sebastião 3,1 43,4 19,0 16,9 11,5 16,1 14,1 3,1 10,5 8,8 171 0,2 62 Sorocaba 9,8 39,1 13,8 13,7 14,7 12,3 8,3 11,4 8,9 8,7 1.484 1,8 63 Lins 5,1 24,1 7,6 7,5 10,4 11,8 11,7 17,4 10,1 8,6 146 0,2 64 Dia<strong>de</strong>ma 5,4 14,1 6,7 8,0 7,1 7,3 4,0 6,6 8,3 8,5 577 0,7 65 Jardinópolis 4,2 18,5 13,0 - 9,4 9,2 6,0 5,8 2,9 8,5 49 0,1 66 Poá 4,1 20,1 7,3 11,3 5,1 5,0 4,9 6,7 4,7 8,4 163 0,2 67 Jandira - 14,8 7,7 8,5 4,1 10,1 2,9 4,8 8,4 8,2 129 0,2 68 Santo André 11,8 25,1 8,6 10,3 9,6 10,6 7,4 9,9 10,2 8,2 1.667 2,0 69 Embu-Guaçu 2,9 17,9 5,3 7,0 8,6 3,4 3,3 6,6 8,2 8,2 78 0,1 70 Cajamar - 7,3 2,0 3,8 1,9 5,4 3,5 8,5 3,3 8,1 67 0,1 71 Caieiras - 13,3 4,2 10,9 9,3 5,1 2,5 4,8 3,5 8,0 89 0,1 72 Guaratinguetá 6,0 29,7 11,5 9,5 7,5 20,4 12,8 14,5 14,3 8,0 226 0,3 73 Franca 3,1 21,5 7,3 13,0 11,1 11,5 10,0 10,4 10,3 8,0 612 0,7 32 Fonte: Fundação Sistema Estadual <strong>de</strong> Análise <strong>de</strong> Da<strong>dos</strong> - SEADE (*) Por 100.000 habitantes Dezembro 2008
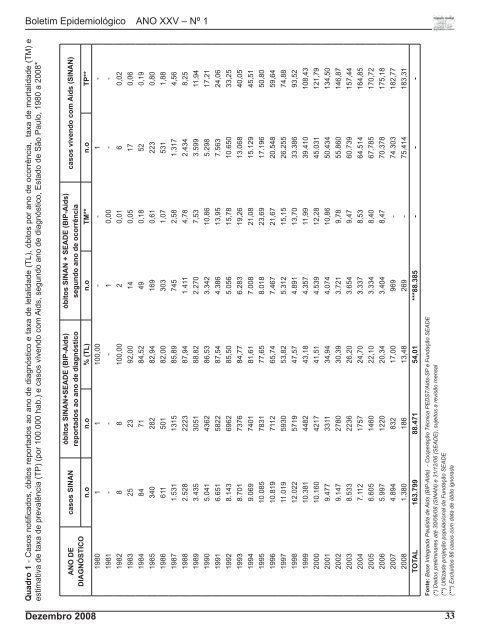
Boletim Epi<strong>de</strong>miológico ANO XXV – Nº 1 Quadro 1 - Casos <strong>no</strong>tifi ca<strong>dos</strong>, óbitos reporta<strong>dos</strong> ao a<strong>no</strong> <strong>de</strong> diagnóstico e taxa <strong>de</strong> letalida<strong>de</strong> (TL), óbitos por a<strong>no</strong> <strong>de</strong> ocorrência, taxa <strong>de</strong> mortalida<strong>de</strong> (TM) e estimativa <strong>de</strong> taxa <strong>de</strong> prevalência (TP) (por 100.000 hab.) e casos vivendo com Aids, segundo a<strong>no</strong> <strong>de</strong> diagnóstico, Estado <strong>de</strong> São Paulo, 1980 a 2008* ANO DE DIAGNÓSTICO casos SINAN óbitos SINAN+SEADE (BIP-Aids) reporta<strong>dos</strong> ao a<strong>no</strong> <strong>de</strong> diagnóstico óbitos SINAN + SEADE (BIP-Aids) segundo a<strong>no</strong> <strong>de</strong> ocorrência casos vivendo com Aids (SINAN) n.o n.o % (TL) n.o TM** n.o TP** 1980 1 1 100,00 - - 1 - 1981 - - - 1 0,00 - - 1982 8 8 100,00 2 0,01 6 0,02 1983 25 23 92,00 14 0,05 17 0,06 1984 84 71 84,52 49 0,18 52 0,19 1985 340 282 82,94 169 0,61 223 0,80 1986 611 501 82,00 303 1,07 531 1,88 1987 1.531 1315 85,89 745 2,58 1.317 4,56 1988 2.528 2223 87,94 1.411 4,78 2.434 8,25 1989 3.435 3051 88,82 2.270 7,53 3.599 11,94 1990 5.041 4362 86,53 3.342 10,86 5.298 17,21 1991 6.651 5822 87,54 4.386 13,95 7.563 24,06 1992 8.143 6962 85,50 5.056 15,78 10.650 33,25 1993 8.701 7376 84,77 6.283 19,26 13.068 40,05 1994 9.069 7401 81,61 7.008 21,08 15.129 45,51 1995 10.085 7831 77,65 8.018 23,69 17.196 50,80 1996 10.819 7112 65,74 7.467 21,67 20.548 59,64 1997 11.019 5930 53,82 5.312 15,15 26.255 74,88 1998 12.022 5719 47,57 4.891 13,70 33.386 93,52 1999 10.381 4482 43,18 4.357 11,99 39.410 108,43 2000 10.160 4217 41,51 4.539 12,28 45.031 121,79 2001 9.477 3311 34,94 4.074 10,86 50.434 134,50 2002 9.147 2780 30,39 3.721 9,78 55.860 146,87 2003 8.533 2236 26,20 3.654 9,47 60.739 157,44 2004 7.112 1757 24,70 3.337 8,53 64.514 164,85 2005 6.605 1460 22,10 3.334 8,40 67.785 170,72 2006 5.997 1220 20,34 3.404 8,47 70.378 175,18 2007 4.894 832 17,00 969 - 74.303 182,77 2008 1.380 186 13,48 269 - 75.414 183,31 TOTAL 163.799 88.471 54,01 ***88.385 - - - Fonte: Base Integrada Paulista <strong>de</strong> Aids (BIP-Aids) - Cooperação Técnica PEDST/Aids-SP e Fundação SEADE (*) Da<strong>dos</strong> preliminares até 30/06/08 (SINAN) e 31/12/06 (SEADE), sujeitos a revisão mensal (**) Utilizada projeção populacional da Fundação SEADE (***) Excluí<strong>dos</strong> 86 casos com data <strong>de</strong> óbito ig<strong>no</strong>rada Dezembro 2008 33