Autosserviço fecha 2010 com R$ 203,9 bilhões, alta real nas ...
Autosserviço fecha 2010 com R$ 203,9 bilhões, alta real nas ...
Autosserviço fecha 2010 com R$ 203,9 bilhões, alta real nas ...
- No tags were found...

Create successful ePaper yourself
Turn your PDF publications into a flip-book with our unique Google optimized e-Paper software.
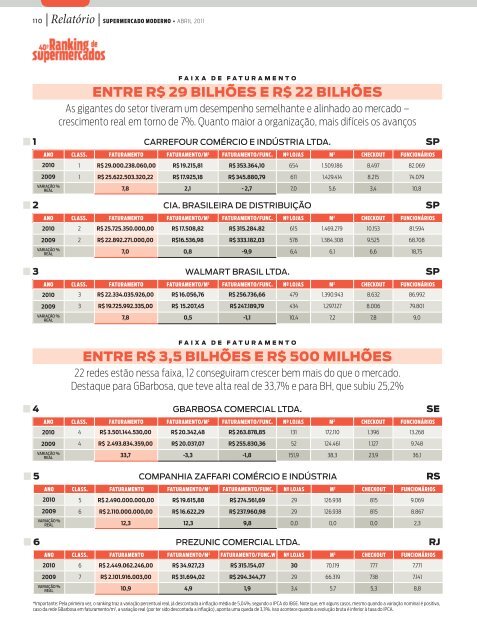
110 | Relatório | s upermerCAdo m oderno • abril 20111 CARREFOUR COMÉRCIO E INDÚSTRIA LTDA. SPAno ClAss. FAturAmento FAturAmento/m 2 FAturAmento/FunC. nº lojAs m 2 CheCkout FunCionários<strong>2010</strong>2009Variação %<strong>real</strong>2 CIA. BRASILEIRA DE DISTRIBUIÇÃO SPAno ClAss. FAturAmento FAturAmento/m 2 FAturAmento/FunC. nº lojAs m 2 CheCkout FunCionários<strong>2010</strong>2009Variação %<strong>real</strong>3 WALMART BRASIL LTDA. SPAno ClAss. FAturAmento FAturAmento/m 2 FAturAmento/FunC. nº lojAs m 2 CheCkout FunCionários<strong>2010</strong>2009Variação %<strong>real</strong>faixa dE f atuR amE ntoEntRE <strong>R$</strong> 29 bilhõES E <strong>R$</strong> 22 bilhõESas gigantes do setor tiveram um desempenho semelhante e alinhado ao mercado –crescimento <strong>real</strong> em torno de 7%. Quanto maior a organização, mais difíceis os avanços1 <strong>R$</strong> 29.000.238.060,00 <strong>R$</strong> 19.215,81 <strong>R$</strong> 353.364,10 654 1.509.186 8.497 82.0691 <strong>R$</strong> 25.622.503.320,22 <strong>R$</strong> 17.925,18 <strong>R$</strong> 345.880,79 611 1.429.414 8.215 74.0797,8 2,1 - 2,7 7,0 5,6 3,4 10,82 <strong>R$</strong> 25.725.350.000,00 <strong>R$</strong> 17.508,82 <strong>R$</strong> 315.284.82 615 1.469.279 10.153 81.5942 <strong>R$</strong> 22.892.271.000,00 <strong>R$</strong>16.536,98 <strong>R$</strong> 333.182,03 578 1.384.308 9.525 68.7087,0 0,8 -9,9 6,4 6,1 6,6 18,753 <strong>R$</strong> 22.334.035.926,00 <strong>R$</strong> 16.056,76 <strong>R$</strong> 256.736,66 479 1.390.943 8.632 86.9923 <strong>R$</strong> 19.725.992.335,00 <strong>R$</strong> 15.207,45 <strong>R$</strong> 247.189,79 434 1.297.127 8.006 79.8017,8 0,5 -1,1 10,4 7,2 7,8 9,04 GBARBOSA COMERCIAL LTDA. SEAno ClAss. FAturAmento FAturAmento/m 2 FAturAmento/FunC. nº lojAs m 2 CheCkout FunCionários<strong>2010</strong>2009Variação %<strong>real</strong>5 COMPANHIA ZAFFARI COMÉRCIO E INDÚSTRIA RSAno ClAss. FAturAmento FAturAmento/m 2 FAturAmento/FunC. nº lojAs m 2 CheCkout FunCionários<strong>2010</strong>2009Variação %<strong>real</strong>6 PREZUNIC COMERCIAL LTDA. RJAno ClAss. FAturAmento FAturAmento/m 2 FAturAmento/FunC.w nº lojAs m 2 CheCkout FunCionários<strong>2010</strong>2009Variação %<strong>real</strong>faixa dE f atuR amE ntoEntRE <strong>R$</strong> 3,5 bilhõES E <strong>R$</strong> 500 milhõES22 redes estão nessa faixa, 12 conseguiram crescer bem mais do que o mercado.Destaque para Gbarbosa, que teve <strong>alta</strong> <strong>real</strong> de 33,7% e para bH, que subiu 25,2%4 <strong>R$</strong> 3.501.144.530,00 <strong>R$</strong> 20.342,48 <strong>R$</strong> 263.878,85 131 172.110 1.396 13.2684 <strong>R$</strong> 2.493.834.359,00 <strong>R$</strong> 20.037,07 <strong>R$</strong> 255.830,36 52 124.461 1.127 9.74833,7 -3,3 -1,8 151,9 38,3 23,9 36,15 <strong>R$</strong> 2.490.000.000,00 <strong>R$</strong> 19.615,88 <strong>R$</strong> 274.561,69 29 126.938 815 9.0696 <strong>R$</strong> 2.110.000.000,00 <strong>R$</strong> 16.622,29 <strong>R$</strong> 237.960,98 29 126.938 815 8.86712,3 12,3 9,8 0,0 0,0 0,0 2,36 <strong>R$</strong> 2.449.062.246,00 <strong>R$</strong> 34.927,23 <strong>R$</strong> 315.154,07 30 70.119 777 7.7717 <strong>R$</strong> 2.101.916.003,00 <strong>R$</strong> 31.694,02 <strong>R$</strong> 294.344,77 29 66.319 738 7.14110,9 4,9 1,9 3,4 5,7 5,3 8,8*Importante: Pela primeira vez, o ranking traz a variação percentual <strong>real</strong>, já descontada a inflação média de 5,04%, segundo o IPCA do IBGE. Note que, em alguns casos, mesmo quando a variação nominal é positiva,caso da rede GBarbosa em faturamento/m 2 , a variação <strong>real</strong> (por ter sido descontada a inflação), aponta uma queda de 3,3%. Isso acontece quando a evolução bruta é inferior à taxa do IPCA.