

Etapa 2
Etapa 2
Etapa 2

You also want an ePaper? Increase the reach of your titles
YUMPU automatically turns print PDFs into web optimized ePapers that Google loves.
Figura 10. Curba de regresie , prezentand evolutia psa in functie de varsta<br />
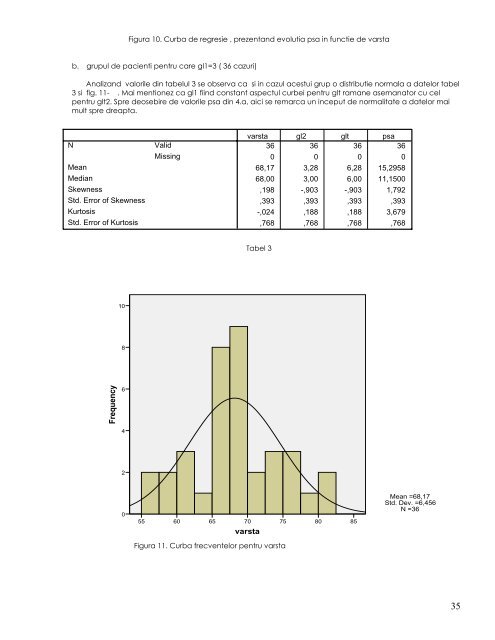
b. grupul de pacienti pentru care gl1=3 ( 36 cazuri)<br />
Analizand valorile din tabelul 3 se observa ca si in cazul acestui grup o distributie normala a datelor tabel<br />
3 si fig. 11- . Mai mentionez ca gl1 fiind constant aspectul curbei pentru glt ramane asemanator cu cel<br />
pentru glt2. Spre deosebire de valorile psa din 4.a, aici se remarca un inceput de normalitate a datelor mai<br />
mult spre dreapta.<br />
N<br />
Mean<br />
Median<br />
Skewness<br />
Std. Error of Skewness<br />
Kurtosis<br />
Std. Error of Kurtosis<br />
8<br />
6<br />
Frequency 10<br />
4<br />
2<br />
0<br />
55<br />
Valid<br />
Missing<br />
60<br />
65<br />
varsta gl2 glt psa<br />
36 36 36 36<br />
0 0 0 0<br />
68,17 3,28 6,28 15,2958<br />
68,00 3,00 6,00 11,1500<br />
,198 -,903 -,903 1,792<br />
,393 ,393 ,393 ,393<br />
-,024 ,188 ,188 3,679<br />
Tabel 3<br />
70<br />
varsta<br />
Figura 11. Curba frecventelor pentru varsta<br />
,768 ,768 ,768 ,768<br />
75<br />
80<br />
85<br />
Mean =68,17<br />
Std. Dev. =6,456<br />
N =36<br />
35
