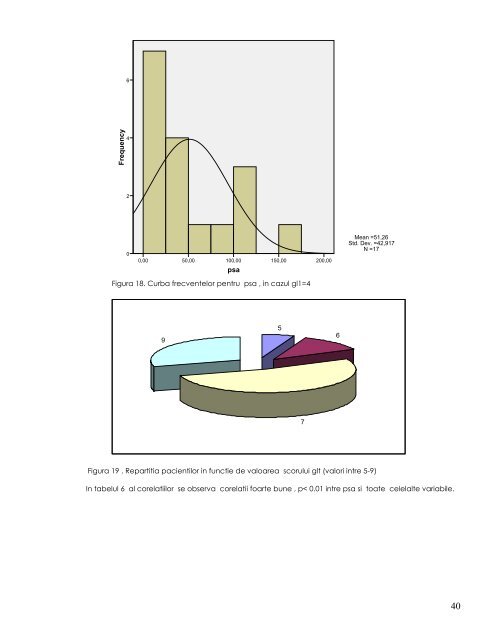
4 Frequency 6 2 0 0,00 50,00 100,00 psa 150,00 Figura 18. Curba frecventelor pentru psa , in cazul gl1=4 9 5 7 200,00 6 Mean =51,26 Std. Dev. =42,917 N =17 Figura 19 . Repartitia pacientilor in functie de valoarea scorului glt (valori intre 5-9) In tabelul 6 al corelatiilor se observa corelatii foarte bune , p< 0.01 intre psa si toate celelalte variabile. 40
varsta gl2 glt psa Pearson Correlation Sig. (2-tailed) N Pearson Correlation Sig. (2-tailed) N Pearson Correlation Sig. (2-tailed) N Pearson Correlation Sig. (2-tailed) N Correlations varsta gl2 glt psa 1 ,036 ,036 ,672** ,892 ,892 ,003 17 17 17 17 ,036 1 1,000** ,639** ,892 ,000 ,006 17 17 17 17 ,036 1,000** 1 ,639** ,892 ,000 ,006 17 17 17 17 ,672** ,639** ,639** 1 ,003 ,006 ,006 **. Correlation is significant at the 0.01 level (2-tailed). d. grupul pacientilor pentru care glt=5 ( 21 cazuri) 17 17 17 17 Tabel 6 Pentru acest grup se remarca o distributie normala pentru psa ( tabel 7, fig 20), o corelatie inversa foarte buna intre gl1 si gl2 ( tabel 8). In ceea ce priveste repartitia cazurilor de remarcat ca cele mai multe cazuri sunt pentru gl1=2 ( 11 cazuri), si gl2=3 ( 9 cazuri). N Mean Std. Deviation Skewness Std. Error of Skewness Kurtosis Std. Error of Kurtosis Valid Missing Statistics Tabel 7 psa varsta 21 21 0 0 12,8000 68,71 6,78081 6,190 1,822 ,044 ,501 ,501 4,388 -,543 ,972 ,972 41
- Page 1 and 2: Raportul Stiintific si Tehnic (RST)
- Page 3 and 4: medicala avand subiecti umani va fi
- Page 5 and 6: In patologia curenta a prostatei, s
- Page 7 and 8: In 1895 croitoreasa doctorului Alfr
- Page 9 and 10: SEMNE MAJORE SEMNE MINORE FOCAR TUM
- Page 11 and 12: Tabel 6. CLASIFICAREA HISTOLOGICALA
- Page 13 and 14: LEZIUNI DISPLAZICE PIN-HG LEZIUNI I
- Page 15 and 16: Tehnica histologica folosita a fost
- Page 17 and 18: Fig. 1. Gradul Gleason Avand in ved
- Page 19 and 20: 62% Repartitia in functie de grupel
- Page 21 and 22: REPARTITIA CAZURILOR IN FUNCTIE DE
- Page 23 and 24: 42% Repartitia cazurilor in functie
- Page 25 and 26: aminoacizi, si cu o GM de 34 kDa. E
- Page 27 and 28: 15 secunde in 3 bai de etanol de 10
- Page 29 and 30: 10,0 7,5 Frequency 12,5 5,0 2,5 0,0
- Page 31 and 32: 50 40 30 Frequency 60 20 10 0 0,00
- Page 33 and 34: varsta gl1 gl2 glt psa Pearson Corr
- Page 35 and 36: Figura 10. Curba de regresie , prez
- Page 37 and 38: 15 10 Frequency 20 5 0 0,00 10,00 2
- Page 39: 4 3 Frequency 5 2 1 0 50 60 70 vars
- Page 43 and 44: e. grupul pacientilor pentru care g
- Page 45 and 46: 10,0 7,5 Frequency 12,5 5,0 2,5 0,0
- Page 47 and 48: O reţea Bayesiana sau o reţea de
- Page 49 and 50: multiplii-Biologie Moleculara), Spi
- Page 51 and 52: 6705 85 ani 5975 71 ani 5974 72 ani
- Page 53 and 54: 69 - + + + - 9 G2 6 61 + - - + - 12
- Page 55 and 56: Figure 2 (opposite page). Molecular
- Page 57 and 58: are relevanta in conditiile in care
- Page 59 and 60: 11. Yamamoto, M., Takeda, K. & Akir
- Page 61 and 62: 86. DeMarzo, A.M., Nelson, W.G., Is