Statistisk årsbok för Sverige 2013 (pdf) - Statistiska centralbyrån
Statistisk årsbok för Sverige 2013 (pdf) - Statistiska centralbyrån
Statistisk årsbok för Sverige 2013 (pdf) - Statistiska centralbyrån

You also want an ePaper? Increase the reach of your titles
YUMPU automatically turns print PDFs into web optimized ePapers that Google loves.
<strong>Statistisk</strong> årsbok <strong>2013</strong><br />
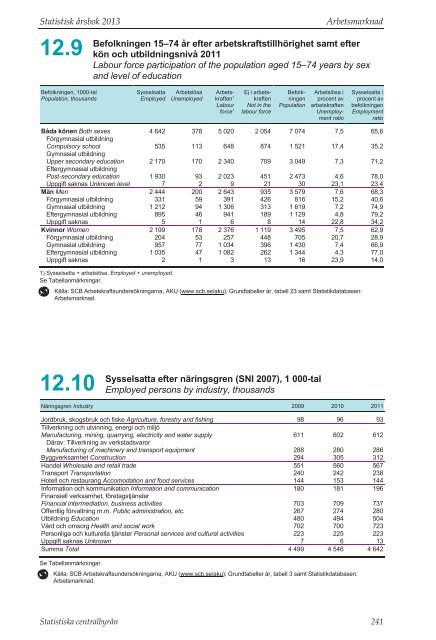
12.9<br />
Arbetsmarknad<br />
Befolkningen 15–74 år efter arbetskraftstillhörighet samt efter<br />
kön och utbildningsnivå 2011<br />
Labour force participation of the population aged 15–74 years by sex<br />
and level of education<br />
Befolkningen, 1000-tal<br />
Population, thousands<br />
Sysselsatta<br />
Employed<br />
Arbetslösa<br />
Unemployed<br />
Arbetskraften<br />
1<br />
Labour<br />
force 1<br />
Ej i arbetskraften<br />
Not in the<br />
labour force<br />
Befolkningen<br />
Population<br />
Arbetslösa i<br />
procent av<br />
arbetskraften<br />
Unemployment<br />
ratio<br />
Sysselsatta i<br />
procent av<br />
befolkningen<br />
Employment<br />
ratio<br />
Båda könen Both sexes 4 642 378 5 020 2 054 7 074 7,5 65,6<br />
Förgymnasial utbildning<br />
Compulsory school 535 113 648 874 1 521 17,4 35,2<br />
Gymnasial utbildning<br />
Upper secondary education 2 170 170 2 340 709 3 049 7,3 71,2<br />
Eftergymnasial utbildning<br />
Post-secondary education 1 930 93 2 023 451 2 473 4,6 78,0<br />
Uppgift saknas Unknown level 7 2 9 21 30 23,1 23,4<br />
Män Men 2 444 200 2 643 935 3 579 7,6 68,3<br />
Förgymnasial utbildning 331 59 391 426 816 15,2 40,6<br />
Gymnasial utbildning 1 212 94 1 306 313 1 619 7,2 74,9<br />
Eftergymnasial utbildning 895 46 941 189 1 129 4,8 79,2<br />
Uppgift saknas 5 1 6 8 14 22,8 34,2<br />
Kvinnor Women 2 199 178 2 376 1 119 3 495 7,5 62,9<br />
Förgymnasial utbildning 204 53 257 448 705 20,7 28,9<br />
Gymnasial utbildning 957 77 1 034 396 1 430 7,4 66,9<br />
Eftergymnasial utbildning 1 035 47 1 082 262 1 344 4,3 77,0<br />
Uppgift saknas 2 1 3 13 16 23,9 14,0<br />
1) Sysselsatta + arbetslösa. Employed + unemployed.<br />
Se Tabellanmärkningar.<br />
Källa: SCB Arbetskraftsundersökningarna, AKU (www.scb.se/aku); Grundtabeller år, tabell 23 samt Statistikdatabasen:<br />
Arbetsmarknad.<br />
12.10<br />
Sysselsatta efter näringsgren (SNI 2007), 1 000-tal<br />
Employed persons by industry, thousands<br />
Näringsgren Industry 2009 2010 2011<br />
Jordbruk, skogsbruk och fiske Agriculture, forestry and fishing 98 96 93<br />
Tillverkning och utvinning, energi och miljö<br />
Manufacturing, mining, quarrying, electricity and water supply 611 602 612<br />
Därav: Tillverkning av verkstadsvaror<br />
Manufacturing of machinery and transport equipment 288 280 286<br />
Byggverksamhet Construction 294 305 312<br />
Handel Wholesale and retail trade 551 560 567<br />
Transport Transportation 240 242 238<br />
Hotell och restaurang Accomodation and food services 144 153 144<br />
Information och kommunikation Information and communication 180 181 196<br />
Finansiell verksamhet, företagstjänster<br />
Financial intermediation, business activities 703 709 737<br />
Offentlig förvaltning m.m. Public administration, etc. 267 274 280<br />
Utbildning Education 480 494 504<br />
Vård och omsorg Health and social work 702 700 723<br />
Personliga och kulturella tjänster Personal services and cultural activities 223 225 223<br />
Uppgift saknas Unknown 7 6 13<br />
Summa Total 4 499 4 546 4 642<br />
Se Tabellanmärkningar.<br />
Källa: SCB Arbetskraftsundersökningarna, AKU (www.scb.se/aku); Grundtabeller år, tabell 3 samt Statistikdatabasen:<br />
Arbetsmarknad.<br />
<strong>Statistisk</strong>a centralbyrån 241