yyti_stv_201600_2016_16179_net
yyti_stv_201600_2016_16179_net
yyti_stv_201600_2016_16179_net

Create successful ePaper yourself
Turn your PDF publications into a flip-book with our unique Google optimized e-Paper software.
Maa-, metsä- ja kalatalous • Jord- och skogsbruk samt fiske<br />
Agriculture, Forestry and Fishery<br />
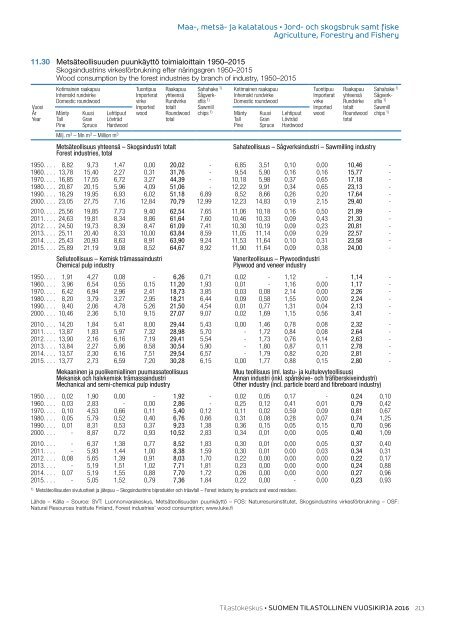
11.30 Metsäteollisuuden puunkäyttö toimialoittain 1950–2015<br />
Skogsindustrins virkesförbrukning efter näringsgren 1950–2015<br />
Wood consumption by the forest industries by branch of industry, 1950–2015<br />
Kotimainen raakapuu Tuontipuu Raakapuu Sahahake 1) Kotimainen raakapuu Tuontipuu Raakapuu Sahahake 1)<br />
Inhemskt rundvirke Importerat yhteensä Sågverk- Inhemskt rundvirke Importerat yhteensä Sågverk-<br />
Domestic roundwood virke Rundvirke sflis 1) Domestic roundwood virke Rundvirke sflis 1)<br />
Vuosi Imported totalt Sawmill Imported totalt Sawmill<br />
År Mänty Kuusi Lehtipuut wood Roundwood chips 1) Mänty Kuusi Lehtipuut wood Roundwood chips 1)<br />
Year Tall Gran Lövträd total Tall Gran Lövträd total<br />
Pine Spruce Hardwood Pine Spruce Hardwood<br />
Milj. m 3 – Mn m 3 – Million m 3<br />
Metsäteollisuus yhteensä – Skogsindustri totalt<br />
Forest industries, total<br />
Sahateollisuus – Sågverksindustri – Sawmilling industry<br />
1950 8,82 9,73 1,47 0,00 20,02 - 6,85 3,51 0,10 0,00 10,46 -<br />
1960 13,78 15,40 2,27 0,31 31,76 - 9,54 5,90 0,16 0,16 15,77 -<br />
1970 16,85 17,55 6,72 3,27 44,39 - 10,18 5,98 0,37 0,65 17,18 -<br />
1980 20,87 20,15 5,96 4,09 51,06 - 12,22 9,91 0,34 0,65 23,13 -<br />
1990 18,29 19,95 6,93 6,02 51,18 6,89 8,52 8,66 0,26 0,20 17,64 -<br />
2000 23,05 27,75 7,16 12,84 70,79 12,99 12,23 14,83 0,19 2,15 29,40 -<br />
2010 25,56 19,85 7,73 9,40 62,54 7,65 11,06 10,18 0,16 0,50 21,89 -<br />
2011 24,63 19,81 8,34 8,86 61,64 7,60 10,46 10,33 0,09 0,43 21,30 -<br />
2012 24,50 19,73 8,39 8,47 61,09 7,41 10,30 10,19 0,09 0,23 20,81 -<br />
2013 25,11 20,40 8,33 10,00 63,84 8,59 11,05 11,14 0,09 0,29 22,57 -<br />
2014 25,43 20,93 8,63 8,91 63,90 9,24 11,53 11,64 0,10 0,31 23,58 -<br />
2015 25,89 21,19 9,08 8,52 64,67 8,92 11,90 11,64 0,09 0,38 24,00 -<br />
Selluteollisuus – Kemisk trämassaindustri<br />
Chemical pulp industry<br />
Vaneriteollisuus – Plywoodindustri<br />
Plywood and veneer industry<br />
1950 1,91 4,27 0,08 - 6,26 0,71 0,02 - 1,12 - 1,14 -<br />
1960 3,96 6,54 0,55 0,15 11,20 1,93 0,01 - 1,16 0,00 1,17 -<br />
1970 6,42 6,94 2,96 2,41 18,73 3,85 0,03 0,08 2,14 0,00 2,26 -<br />
1980 8,20 3,79 3,27 2,95 18,21 6,44 0,09 0,58 1,55 0,00 2,24 -<br />
1990 9,40 2,06 4,78 5,26 21,50 4,54 0,01 0,77 1,31 0,04 2,13 -<br />
2000 10,46 2,36 5,10 9,15 27,07 9,07 0,02 1,69 1,15 0,56 3,41 -<br />
2010 14,20 1,84 5,41 8,00 29,44 5,43 0,00 1,46 0,78 0,08 2,32 -<br />
2011 13,87 1,83 5,97 7,32 28,98 5,70 - 1,72 0,84 0,08 2,64 -<br />
2012 13,90 2,16 6,16 7,19 29,41 5,54 - 1,73 0,76 0,14 2,63 -<br />
2013 13,84 2,27 5,86 8,58 30,54 5,90 - 1,80 0,87 0,11 2,78 -<br />
2014 13,57 2,30 6,16 7,51 29,54 6,57 - 1,79 0,82 0,20 2,81 -<br />
2015 13,77 2,73 6,59 7,20 30,28 6,15 0,00 1,77 0,88 0,15 2,80 -<br />
Mekaaninen ja puolikemiallinen puumassateollisuus<br />
Mekanisk och halvkemisk trämassaindustri<br />
Mechanical and semi-chemical pulp industry<br />
Muu teollisuus (ml. lastu- ja kuitulevyteollisuus)<br />
Annan industri (inkl. spånskive- och träfiberskiveindustri)<br />
Other industry (incl. particle board and fibreboard industry)<br />
1950 0,02 1,90 0,00 - 1,92 - 0,02 0,05 0,17 - 0,24 0,10<br />
1960 0,03 2,83 - 0,00 2,86 - 0,25 0,12 0,41 0,01 0,79 0,42<br />
1970 0,10 4,53 0,66 0,11 5,40 0,12 0,11 0,02 0,59 0,09 0,81 0,67<br />
1980 0,05 5,79 0,52 0,40 6,76 0,66 0,31 0,08 0,28 0,07 0,74 1,25<br />
1990 0,01 8,31 0,53 0,37 9,23 1,38 0,36 0,15 0,05 0,15 0,70 0,96<br />
2000 - 8,87 0,72 0,93 10,52 2,83 0,34 0,01 0,00 0,05 0,40 1,09<br />
2010 - 6,37 1,38 0,77 8,52 1,83 0,30 0,01 0,00 0,05 0,37 0,40<br />
2011 - 5,93 1,44 1,00 8,38 1,59 0,30 0,01 0,00 0,03 0,34 0,31<br />
2012 0,08 5,65 1,39 0,91 8,03 1,70 0,22 0,00 0,00 0,00 0,22 0,17<br />
2013 - 5,19 1,51 1,02 7,71 1,81 0,23 0,00 0,00 0,00 0,24 0,88<br />
2014 0,07 5,19 1,55 0,88 7,70 1,72 0,26 0,00 0,00 0,00 0,27 0,96<br />
2015 - 5,05 1,52 0,79 7,36 1,84 0,22 0,00 - 0,00 0,23 0,93<br />
1) Metsäteollisuuden sivutuotteet ja jätepuu – Skogsindustrins biprodukter och träavfall – Forest industry by-products and wood residues.<br />
Lähde – Källa – Source: SVT: Luonnonvarakeskus, Metsäteollisuuden puunkäyttö – FOS: Naturresursinstitutet, Skogsindustrins virkesförbrukning – OSF:<br />
Natural Resources Institute Finland, Forest industries’ wood consumption; www.luke.fi<br />
Tilastokeskus • SUOMEN TILASTOLLINEN VUOSIKIRJA <strong>2016</strong><br />
213