yyti_stv_201600_2016_16179_net
yyti_stv_201600_2016_16179_net
yyti_stv_201600_2016_16179_net

You also want an ePaper? Increase the reach of your titles
YUMPU automatically turns print PDFs into web optimized ePapers that Google loves.
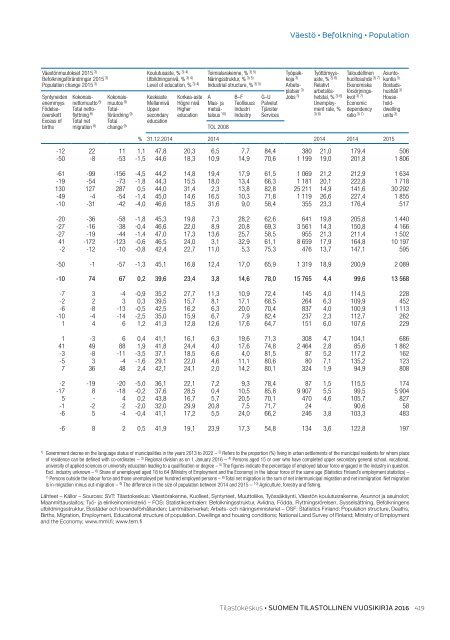
Väestö • Befolkning • Population<br />
Väestönmuutokset 2015 3) Koulutusaste, % 3) 4) Toimialarakenne, % 3) 5) Työpaik- Työttömyys- Taloudellinen Asunto-<br />
Befolkningsförändringar 2015 3) Utbildningsnivå, % 3) 4) Näringsstruktur, % 3) 5) koja 3) aste, % 3) 6) huoltosuhde 3) 7) kuntia 3)<br />
Population change 2015 3) Level of education, % 3) 4) Industrial structure, % 3) 5) Arbets- Relativt Ekonomiska Bostadsplatser<br />
3) arbetslös- försörjnings- hushåll 3)<br />
Syntyneiden Kokonais- Kokonais- Keskiaste Korkea-aste A B–F G–U Jobs 3) hetstal, % 3) 6) kvot 3) 7) Houseenemmyys<br />
<strong>net</strong>tomuutto 8) muutos 9) Mellannivå Högre nivå Maa- ja Teollisuus Palvelut Unemploy- Economic hold-<br />
Födelse- Total <strong>net</strong>to- Total- Upper Higher metsä- Industri Tjänster ment rate, % dependency dwelling<br />
överskott flyttning 8) förändring 9) secondary education talous 10) Industry Services 3) 6) ratio 3) 7) units 3)<br />
Excess of Total <strong>net</strong> Total education<br />
births migration 8) change 9) TOL 2008<br />
% 31.12.2014 2014 2014 2014 2015<br />
-12 22 11 1,1 47,8 20,3 6,5 7,7 84,4 380 21,0 179,4 506<br />
-50 -8 -53 -1,5 44,6 18,3 10,9 14,9 70,6 1 199 19,0 201,8 1 806<br />
-61 -99 -156 -4,5 44,2 14,8 19,4 17,9 61,5 1 069 21,2 212,9 1 634<br />
-19 -54 -73 -1,8 44,3 15,5 18,0 13,4 66,3 1 181 20,1 222,8 1 718<br />
130 127 287 0,5 44,0 31,4 2,3 13,8 82,8 25 211 14,9 141,6 30 292<br />
-49 -4 -54 -1,4 45,0 14,6 16,5 10,3 71,8 1 119 26,6 227,4 1 855<br />
-10 -31 -42 -4,0 46,6 18,5 31,6 9,0 58,4 355 23,3 176,4 517<br />
-20 -36 -58 -1,8 45,3 19,8 7,3 28,2 62,6 641 19,8 205,8 1 440<br />
-27 -16 -38 -0,4 46,6 22,0 8,9 20,8 69,3 3 561 14,3 150,8 4 166<br />
-27 -19 -44 -1,4 47,0 17,3 13,6 25,7 58,5 955 21,3 211,4 1 502<br />
41 -172 -123 -0,6 46,5 24,0 3,1 32,9 61,1 8 659 17,9 164,8 10 197<br />
-2 -12 -10 -0,8 42,4 22,7 11,0 5,3 75,3 476 13,7 147,1 595<br />
-50 -1 -57 -1,3 45,1 16,8 12,4 17,0 65,9 1 319 18,9 200,9 2 089<br />
-10 74 67 0,2 39,6 23,4 3,8 14,6 78,0 15 765 4,4 99,6 13 568<br />
-7 3 -4 -0,9 35,2 27,7 11,3 10,9 72,4 145 4,0 114,5 228<br />
-2 2 3 0,3 39,5 15,7 8,1 17,1 68,5 264 6,3 109,9 452<br />
-6 -8 -13 -0,5 42,5 16,2 6,3 20,0 70,4 837 4,0 100,9 1 113<br />
-10 -4 -14 -2,5 35,0 15,9 6,7 7,9 82,4 237 2,3 112,7 262<br />
1 4 6 1,2 41,3 12,8 12,6 17,6 64,7 151 6,0 107,6 229<br />
1 -3 6 0,4 41,1 16,1 6,3 19,6 71,3 308 4,7 104,1 686<br />
41 49 88 1,9 41,8 24,4 4,0 17,6 74,8 2 464 2,8 85,6 1 862<br />
-3 -8 -11 -3,5 37,1 18,5 6,6 4,0 81,5 87 5,2 117,2 162<br />
-5 3 -4 -1,6 29,1 22,0 4,6 11,1 80,6 80 7,1 135,2 123<br />
7 36 48 2,4 42,1 24,1 2,0 14,2 80,1 324 1,9 94,9 808<br />
-2 -19 -20 -5,0 36,1 22,1 7,2 9,3 78,4 87 1,5 115,5 174<br />
-17 8 -18 -0,2 37,6 28,5 0,4 10,5 85,8 9 907 5,5 99,5 5 904<br />
5 - 4 0,2 43,8 16,7 5,7 20,5 70,1 470 4,6 105,7 827<br />
-1 -2 -2 -2,0 32,0 29,9 20,8 7,5 71,7 24 . 90,6 58<br />
-6 5 -4 -0,4 41,1 17,2 5,5 24,0 66,2 246 3,8 103,3 483<br />
-6 8 2 0,5 41,9 19,1 23,9 17,3 54,8 134 3,6 122,8 197<br />
1) Government decree on the language status of municipalities in the years 2013 to 2022 – 2) Refers to the proportion (%) living in urban settlements of the municipal residents for whom place<br />
of residence can be defined with co-ordinates – 3) Regional division as on 1 January <strong>2016</strong> – 4) Persons aged 15 or over who have completed upper secondary general school, vocational,<br />
university of applied sciences or university education leading to a qualification or degree – 5) The figures indicate the percentage of employed labour force engaged in the industry in question.<br />
Excl. industry unknown – 6) Share of unemployed aged 18 to 64 (Ministry of Employment and the Economy) in the labour force of the same age (Statistics Finland’s employment statistics) –<br />
7) Persons outside the labour force and those unemployed per hundred employed persons – 8) Total <strong>net</strong> migration is the sum of <strong>net</strong> intermunicipal migration and <strong>net</strong> immigration. Net migration<br />
is in-migration minus out-migration – 9) The difference in the size of population between 2014 and 2015 – 10) Agriculture, forestry and fishing.<br />
Lähteet – Källor – Sources: SVT: Tilastokeskus: Väestörakenne, Kuolleet, Syntyneet, Muuttoliike, Työssäkäynti, Väestön koulutusrakenne, Asunnot ja asuinolot;<br />
Maanmittauslaitos; Työ- ja elinkeinoministeriö – FOS: Statistikcentralen: Befolkningsstruktur, Avlidna, Födda, Flyttningsrörelsen, Sysselsättning, Befolkningens<br />
utbildningsstruktur, Bostäder och boendeförhållanden; Lantmäteriverket; Arbets- och näringsministeriet – OSF: Statistics Finland: Population structure, Deaths,<br />
Births, Migration, Employment, Educational structure of population, Dwellings and housing conditions; National Land Survey of Finland; Ministry of Employment<br />
and the Economy; www.mml.fi; www.tem.fi<br />
Tilastokeskus • SUOMEN TILASTOLLINEN VUOSIKIRJA <strong>2016</strong><br />
419