Metropolregionen im Vergleich: Berlin – London – Wien
Metropolregionen im Vergleich: Berlin – London – Wien
Metropolregionen im Vergleich: Berlin – London – Wien

Sie wollen auch ein ePaper? Erhöhen Sie die Reichweite Ihrer Titel.
YUMPU macht aus Druck-PDFs automatisch weboptimierte ePaper, die Google liebt.
<strong>Metropolregionen</strong> <strong>im</strong> <strong>Vergleich</strong>: <strong>Berlin</strong> <strong>London</strong> - <strong>Wien</strong><br />
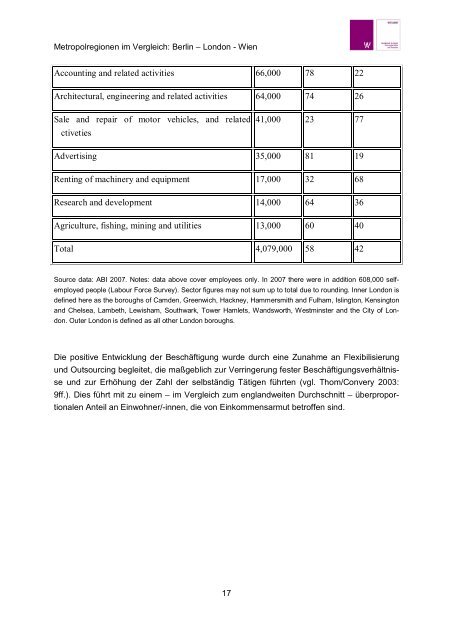
Accounting and related activities 66,000 78 22<br />
Architectural, engineering and related activities 64,000 74 26<br />
Sale and repair of motor vehicles, and related<br />
ctiveties<br />
17<br />
41,000 23 77<br />
Advertising 35,000 81 19<br />
Renting of machinery and equipment 17,000 32 68<br />
Research and development 14,000 64 36<br />
Agriculture, fishing, mining and utilities 13,000 60 40<br />
Total 4,079,000 58 42<br />
Source data: ABI 2007. Notes: data above cover employees only. In 2007 there were in addition 608,000 self-<br />
employed people (Labour Force Survey). Sector figures may not sum up to total due to rounding. Inner <strong>London</strong> is<br />
defined here as the boroughs of Camden, Greenwich, Hackney, Hammersmith and Fulham, Islington, Kensington<br />
and Chelsea, Lambeth, Lewisham, Southwark, Tower Hamlets, Wandsworth, Westminster and the City of Lon-<br />
don. Outer <strong>London</strong> is defined as all other <strong>London</strong> boroughs.<br />
Die positive Entwicklung der Beschäftigung wurde durch eine Zunahme an Flexibilisierung<br />
und Outsourcing begleitet, die maßgeblich zur Verringerung fester Beschäftigungsverhältnis-<br />
se und zur Erhöhung der Zahl der selbständig Tätigen führten (vgl. Thom/Convery 2003:<br />
9ff.). Dies führt mit zu einem <strong>im</strong> <strong>Vergleich</strong> zum englandweiten Durchschnitt überpropor-<br />
tionalen Anteil an Einwohner/-innen, die von Einkommensarmut betroffen sind.