bunsenmagazin - Deutsche Bunsengesellschaft für Physikalische ...
bunsenmagazin - Deutsche Bunsengesellschaft für Physikalische ...
bunsenmagazin - Deutsche Bunsengesellschaft für Physikalische ...

Sie wollen auch ein ePaper? Erhöhen Sie die Reichweite Ihrer Titel.
YUMPU macht aus Druck-PDFs automatisch weboptimierte ePaper, die Google liebt.
UNTERRICHT<br />
resolved in solid-state c.w. EPR spectra can be separated and<br />
precisely measured with appropriate pulse sequences3 . The<br />
most popular techniques are concerned with determining hfi<br />
with nuclear spins near the paramagnetic center and with measuring<br />
distances between such centers. The possibility to add<br />
additional rf pulses, driving nuclear spin transitions, opened<br />
the way to apply ENDOR for a larger group of samples than with<br />
c.w. techniques. By now pulsed ENDOR has superseded c. w.<br />
ENDOR almost completely. This aspect is described in more<br />
detail in section D.<br />
At present, commercial pulsed EPR spectrometers are available<br />
working at 3.5, 9, 35 and 94 GHz. Excitation pulse lengths, defi ned<br />
by a π / 2 pulse are of the order of 10 ns (at 9 GHz) to about<br />
30 ns (at 3.5, 35, and 94 GHz). The corresponding excitation<br />
bandwidth is still somewhat limited (30 MHz and 10 MHz, respectively),<br />
but suffi cient to investigate a wide class of paramagnetic<br />
centers in solid matrices by echo experiments. In particular,<br />
dynamical processes can be probed by measuring relaxation<br />
times as function of temperature, limited only by the dead time<br />
of the spectrometer of approximately 50 ns.<br />
Many pulsed EPR experiments can be understood on the basis<br />
of concepts that are familiar from pulsed NMR spectroscopy.<br />
The most important exception are electron spin echo envelope<br />
modulation (ESEEM) experiments that rely on the excitation<br />
of formally forbidden transitions in which both the electron<br />
and nuclear spin magnetic quantum numbers change by unity.<br />
Such experiments are explained in more detail in Box 4. Using<br />
these techniques the NMR spectra of paramagnetic substances<br />
can be determined. In three-pulse ESEEM the fi rst two pulses<br />
generate nuclear coherence that evolves during a variable interpulse<br />
delay T between the second and third pulse. The third<br />
pulse reconverts the nuclear coherence to observable electron<br />
coherence and simultaneously creates a stimulated echo. The<br />
spectrum is obtained by Fourier transformation of time traces<br />
that are acquired by measuring echo intensity as a function of<br />
delay T.<br />
The most informative type of ESEEM spectroscopy is two-dimensional<br />
hyperfi ne sublevel correlation spectroscopy (HYSCORE) 13 ,<br />
which is an extension of three-pulse ESEEM. In this experiment<br />
the variable delay T is separated by a mw π pulse into two variable<br />
delays t1 and t2. The π pulse inverts the electron spin and<br />
thus the hyperfi ne fi eld at the nucleus. As a result, the nuclear<br />
frequencies corresponding to the electron spin α and β manifolds<br />
are correlated with each other. A plot of the spectrum<br />
separates the nuclear Zeeman interaction (shift along the diagonal),<br />
the hfi (splitting along the antidiagonal), and the nuclear<br />
quadrupole interaction (splitting along the diagonal). For powder<br />
samples or frozen solutions each hyperfi ne coupling is represented<br />
by a ridge that is roughly parallel to the antidiagonal.<br />
The level mixing by anisotropic hyperfi ne interaction leads to<br />
small orientation-dependent frequency shifts, so that the ridges<br />
are somewhat curved. By analyzing the curvature the anisotropic<br />
and isotropic contributions to the hfi can be separated14 .<br />
At present a restriction of the applicability of this very powerful<br />
method is given by the fi nite excitation width, thus allowing for<br />
the investigation of rather small hfi only. Extension to larger hfi<br />
would require going to higher fi elds to match nuclear Zeeman<br />
interaction to the larger hfi and achieving shorter mw pulse<br />
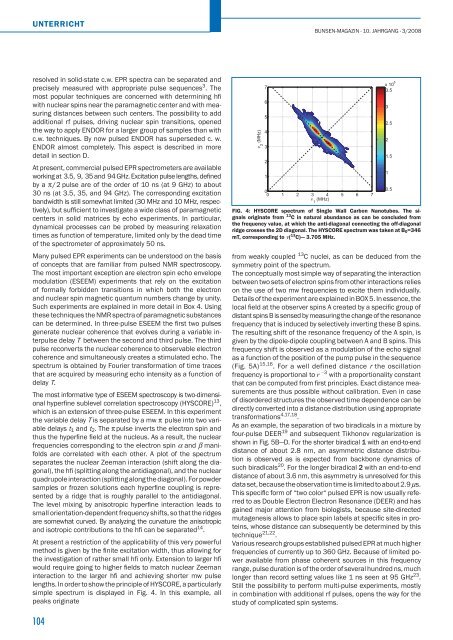
lengths. In order to show the principle of HYSCORE, a particularly<br />
simple spectrum is displayed in Fig. 4. In this example, all<br />
peaks originate<br />
104<br />
ν 2 (MHz)<br />
7<br />
6<br />
5<br />
4<br />
3<br />
2<br />
1<br />
BUNSEN-MAGAZIN · 10. JAHRGANG · 3/2008<br />
0<br />
0 1 2 3 4 5 6 7<br />
ν (MHz)<br />
1<br />
x 10<br />
3.5<br />
6<br />
FIG. 4: HYSCORE spectrum of Single Wall Carbon Nanotubes. The signals<br />
originate from 13 C in natural abundance as can be concluded from<br />
the frequency value, at which the anti-diagonal connecting the off-diagonal<br />
ridge crosses the 2D diagonal. The HYSCORE spectrum was taken at B0=346<br />
mT, corresponding to ν( 13 C)— 3.705 MHz.<br />
from weakly coupled 13 C nuclei, as can be deduced from the<br />
symmetry point of the spectrum.<br />
The conceptually most simple way of separating the interaction<br />
between two sets of electron spins from other interactions relies<br />
on the use of two mw frequencies to excite them individually.<br />
Details of the experiment are explained in BOX 5. In essence, the<br />
local fi eld at the observer spins A created by a specifi c group of<br />
distant spins B is sensed by measuring the change of the resonance<br />
frequency that is induced by selectively inverting these B spins.<br />
The resulting shift of the resonance frequency of the A spin, is<br />
given by the dipole-dipole coupling between A and B spins. This<br />
frequency shift is observed as a modulation of the echo signal<br />
as a function of the position of the pump pulse in the sequence<br />
(Fig. 5A) 15,16 . For a well defined distance r the oscillation<br />
frequency is proportional to r –3 with a proportionality constant<br />
that can be computed from fi rst principles. Exact distance measurements<br />
are thus possible without calibration. Even in case<br />
of disordered structures the observed time dependence can be<br />
directly converted into a distance distribution using appropriate<br />
transformations 4,17,18 .<br />
As an example, the separation of two biradicals in a mixture by<br />
four-pulse DEER 19 and subsequent Tikhonov regularization is<br />
shown in Fig. 5B—D. For the shorter biradical 1 with an end-to-end<br />
distance of about 2.8 nm, an asymmetric distance distribution<br />
is observed as is expected from backbone dynamics of<br />
such biradicals 20 . For the longer biradical 2 with an end-to-end<br />
distance of about 3.6 nm, this asymmetry is unresolved for this<br />
data set, because the observation time is limited to about 2.9 μs.<br />
This specifl c form of “two color“ pulsed EPR is now usually referred<br />
to as Double Electron Electron Resonance (DEER) and has<br />
gained major attention from biologists, because site-directed<br />
mutagenesis allows to place spin labels at specifi c sites in proteins,<br />
whose distance can subsequently be determined by this<br />
technique 21,22 .<br />
Various research groups established pulsed EPR at much higher<br />
frequencies of currently up to 360 GHz. Because of limited power<br />
available from phase coherent sources in this frequency<br />
range, pulse duration is of the order of several hundred ns, much<br />
longer than record setting values like 1 ns seen at 95 GHz 23 .<br />
Still the possibility to perform multi-pulse experiments, mostly<br />
in combination with additional rf pulses, opens the way for the<br />
study of complicated spin systems.<br />
3<br />
2.5<br />
2<br />
1.5<br />
1<br />
0.5