bunsenmagazin - Deutsche Bunsengesellschaft für Physikalische ...
bunsenmagazin - Deutsche Bunsengesellschaft für Physikalische ...
bunsenmagazin - Deutsche Bunsengesellschaft für Physikalische ...

Sie wollen auch ein ePaper? Erhöhen Sie die Reichweite Ihrer Titel.
YUMPU macht aus Druck-PDFs automatisch weboptimierte ePaper, die Google liebt.
UNTERRICHT<br />
Structural resolution in such studies is not necessarily restricted<br />
by the use of nitroxide spin labels, if their conformational<br />
distribution is taken into account 41,42 . Models can be<br />
defi ned in terms of distance distributions that can be fi tted to<br />
experimental data 20 . For example consider the highly-resolved<br />
structure of the dimer of the sodium/proton antiporter NhaA<br />
of Escherichia coli 40 , based on an x-ray structure of the monomer<br />
and DEER measurements of nine spin-labelled mutants<br />
(Figure 13A). The relative orientation and positioning of the<br />
monomers in a homodimer are characterized by only four parameters,<br />
two polar angles and a two-component translation vector<br />
in the membrane plane. The distribution of the label position<br />
was modelled by using a rotamer library of preferred spin label<br />
conformations and computing Boltzmann statistics of these<br />
conformations according to their interaction energy with the<br />
protein. After determining the four free structural parameters<br />
from the nine data sets, the structure was tested for integrity<br />
by repeating the fi t with only seven out of the nine constraints<br />
and noise added to the data sets. The family of 144 structures<br />
obtained in this test had a root mean square deviation of only<br />
0.6 Å from the best structure. Structural resolution is thus<br />
limited by resolution of the x-ray structure of the monomer<br />
of 3.45 Å and not by the SDSL/DEER approach. The derived<br />
dimer structure has no clashes between the two monomers<br />
and the interfacial domains fi t surprisingly well to a low-resolution<br />
electron density map obtained by cryo-transmission electron<br />
microscopy on two-dimensional crystals (Figure 13B).<br />
IV. OUTLOOK<br />
As indicated by the chosen examples, the recent technological<br />
development of EMR has opened the way to explore basic questions<br />
beyond the study of simple spin doublets. EMR can now<br />
be applied for the study of high spin systems not only realized<br />
in molecular magnets, but which are also abundant in catalytic<br />
centers in biology and material sciences. Apart from the study<br />
of permanent paramagnetic centers, pulsed EMR also allows<br />
to follow chemical reactions on<br />
FIG. 13: Highly resolved structural model of the dimer of the sodium/proton<br />
antiporter NhaA of Escherichia coli obtained from an x-ray structure of the<br />
monomer and SDSL EPR data 40 . (A) Side view of the model. Spin labelled residues<br />
are marked red and die distances measured by DEER are indicated by<br />
red lines. (B) Superposition of a top view of the structure with a low-resolution<br />
electron density map obtained by cryo-TEM on a two-dimensional crystal.<br />
The interfacial domain (marked blue) fits well, while the ion translocation<br />
domain (marked red) appears to be rotated.<br />
the microsecond scale, confi rming the importance of electronic<br />
spins in controlling reaction pathways 43,44 . A booming application<br />
area is given by diamagnetic biomacromolecules that have become<br />
accessible to EMR by spin labeling. Within the next few<br />
years we expect the development of systematic approaches for<br />
deriving structural models from SDSL EPR data. We will also<br />
108<br />
see the application of EMR techniques for implementing pulse<br />
sequences for quantum computing, a fi eld which highly benefi<br />
ts from the vast knowledge base for the manipulation of density<br />
matrices, accumulated over decades by the NMR community<br />
45 . The reintroduction of electrical read-out of EMR signals<br />
in this context is also a very promising task 46 . In the near future<br />
we will probably also see applications of single molecule EMR,<br />
a technique demonstrated to work in principle 47 .<br />
V. BOX 1<br />
ESR/EPR spectroscopy is related to the energy dependence of<br />
the magnetic moment of an electron in a magnetic fi eld. The<br />
Zeeman effect, which was originally detected via optical spectroscopy,<br />
could be related to its total angular momentum, consisting<br />
of orbital and spin contributions. In a condensed phase<br />
orbital momenta are quite generally suppressed (“quenched“),<br />
thus leaving the spin angular momentum as dominant part.<br />
Because of the collinearity of angular momentum and magnetic<br />
moment, on can defi ne a scalar proportionality constant, the<br />
magnetogyric ratio γ leading to<br />
μe = γS<br />
γ = −gμe<br />
H = μeBgS<br />
The last equation is defi ning the effective spin Hamiltonian H,<br />
allowing to calculate the energy levels and subsequently the<br />
transition frequencies as function of an external magnetic fi eld<br />
B. In general, coupling the two vector operators B and S necessitates<br />
to express g as a 3x3 matrix. For the description of<br />
spectra obtained under conditions of rapid isotropic averaging,<br />
instead of a g matrix a scalar g value can be used, defi ned by<br />
one third of the trace of the matrix elements. For the eigenvalues<br />
we then fi nd<br />
E = mSgμeB<br />
(9)<br />
(10)<br />
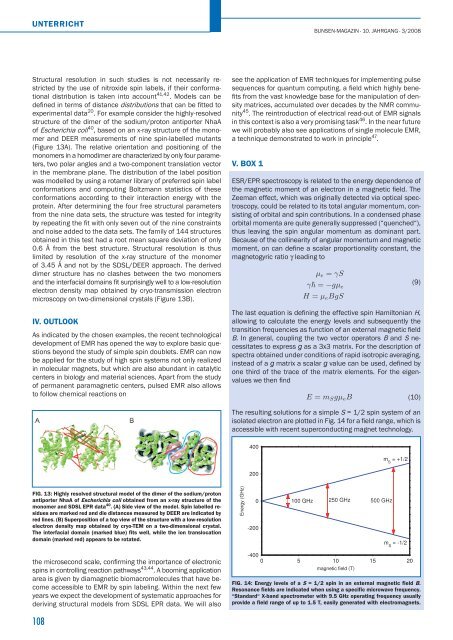
The resulting solutions for a simple S = 1/2 spin system of an<br />
isolated electron are plotted in Fig. 14 for a fi eld range, which is<br />
accessible with recent superconducting magnet technology.<br />
Energy (GHz)<br />
400<br />
200<br />
0<br />
-200<br />
100 GHz<br />
BUNSEN-MAGAZIN · 10. JAHRGANG · 3/2008<br />
250 GHz<br />
500 GHz<br />
m S = +1/2<br />
m S = -1/2<br />
-400<br />
0 5 10 15 20<br />
magnetic field (T)<br />
FIG. 14: Energy levels of a S = 1/2 spin in an external magnetic field B.<br />
Resonance fields are indicated when using a specific microwave frequency.<br />
“Standard“ X-band spectrometer with 9.5 GHz operating frequency usually<br />
provide a field range of up to 1.5 T, easily generated with electromagnets.