Full page photo print - WSU Puyallup Research and Extension ...
Full page photo print - WSU Puyallup Research and Extension ...
Full page photo print - WSU Puyallup Research and Extension ...

You also want an ePaper? Increase the reach of your titles
YUMPU automatically turns print PDFs into web optimized ePapers that Google loves.
Native Plant Synoptic Garden<br />
10<br />
____________________________________________________________________________________________________________<br />
(see Figure 3) fog can mediate daily water stress; as a result many of Western Washington’s<br />
plants are adapted to these specific conditions.<br />
Wind<br />
Using data<br />
collected at Sea-Tac<br />
International Airport <strong>and</strong><br />
at Boeing Field by the<br />
Western Regional Climate<br />
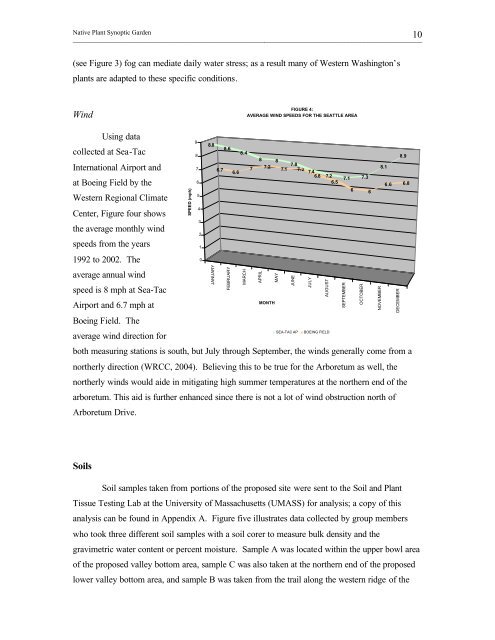
Center, Figure four shows<br />
the average monthly wind<br />
speeds from the years<br />
1992 to 2002. The<br />
average annual wind<br />
speed is 8 mph at Sea-Tac<br />
Airport <strong>and</strong> 6.7 mph at<br />
Boeing Field. The<br />
average wind direction for<br />
both measuring stations is south, but July through September, the winds generally come from a<br />
northerly direction (WRCC, 2004). Believing this to be true for the Arboretum as well, the<br />
northerly winds would aide in mitigating high summer temperatures at the northern end of the<br />
arboretum. This aid is further enhanced since there is not a lot of wind obstruction north of<br />
Arboretum Drive.<br />
Soils<br />
SPEED (mph)<br />
9<br />
8<br />
7<br />
6<br />
5<br />
4<br />
3<br />
2<br />
1<br />
0<br />
8.8<br />
8.6<br />
8.4<br />
6.7<br />
6.6<br />
7<br />
8<br />
7.2<br />
8<br />
7.1<br />
7.8<br />
7.2<br />
7.4<br />
6.8 7.2<br />
6.5<br />
JANUARY<br />
FEBRUARY<br />
Soil samples taken from portions of the proposed site were sent to the Soil <strong>and</strong> Plant<br />
Tissue Testing Lab at the University of Massachusetts (UMASS) for analysis; a copy of this<br />
analysis can be found in Appendix A. Figure five illustrates data collected by group members<br />
who took three different soil samples with a soil corer to measure bulk density <strong>and</strong> the<br />
MARCH<br />
FIGURE 4:<br />
AVERAGE WIND SPEEDS FOR THE SEATTLE AREA<br />
gravimetric water content or percent moisture. Sample A was located within the upper bowl area<br />
of the proposed valley bottom area, sample C was also taken at the northern end of the proposed<br />
lower valley bottom area, <strong>and</strong> sample B was taken from the trail along the western ridge of the<br />
APRIL<br />
MONTH<br />
MAY<br />
JUNE<br />
JULY<br />
AUGUST<br />
SEA-TAC AP BOEING FIELD<br />
SEPTEMBER<br />
7.1<br />
6 6<br />
OCTOBER<br />
7.3<br />
NOVEMBER<br />
8.1<br />
6.6<br />
DECEMBER<br />
8.9<br />
6.8