Thesis Re-print: Does Selling Fruits or Vegetables - Department of ...
Thesis Re-print: Does Selling Fruits or Vegetables - Department of ...
Thesis Re-print: Does Selling Fruits or Vegetables - Department of ...

You also want an ePaper? Increase the reach of your titles
YUMPU automatically turns print PDFs into web optimized ePapers that Google loves.
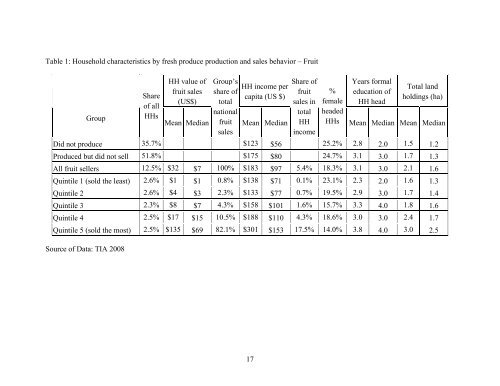
Table 1: Household characteristics by fresh produce production and sales behavi<strong>or</strong> – Fruit<br />
Group<br />
Share<br />
<strong>of</strong> all<br />
HH value <strong>of</strong><br />
fruit sales<br />
(US$)<br />
HHs Mean Median<br />
Group’s<br />
share <strong>of</strong><br />
total<br />
national<br />
fruit<br />
sales<br />
HH income per<br />
capita (US $)<br />
Mean Median<br />
17<br />
Share <strong>of</strong><br />
fruit<br />
sales in<br />
total<br />
HH<br />
income<br />
%<br />
female<br />
headed<br />
Years f<strong>or</strong>mal<br />
education <strong>of</strong><br />
HH head<br />
Total land<br />
holdings (ha)<br />
HHs Mean Median Mean Median<br />
Did not produce 35.7% $123 $56 25.2% 2.8 2.0 1.5 1.2<br />
Produced but did not sell 51.8% $175 $80 24.7% 3.1 3.0 1.7 1.3<br />
All fruit sellers 12.5% $32 $7 100% $183 $97 5.4% 18.3% 3.1 3.0 2.1 1.6<br />
Quintile 1 (sold the least) 2.6% $1 $1 0.8% $138 $71 0.1% 23.1% 2.3 2.0 1.6 1.3<br />
Quintile 2 2.6% $4 $3 2.3% $133 $77 0.7% 19.5% 2.9 3.0 1.7 1.4<br />
Quintile 3 2.3% $8 $7 4.3% $158 $101 1.6% 15.7% 3.3 4.0 1.8 1.6<br />
Quintile 4 2.5% $17 $15 10.5% $188 $110 4.3% 18.6% 3.0 3.0 2.4 1.7<br />
Quintile 5 (sold the most) 2.5% $135 $69 82.1% $301 $153 17.5% 14.0% 3.8 4.0 3.0 2.5<br />
Source <strong>of</strong> Data: TIA 2008