Thesis Re-print: Does Selling Fruits or Vegetables - Department of ...
Thesis Re-print: Does Selling Fruits or Vegetables - Department of ...
Thesis Re-print: Does Selling Fruits or Vegetables - Department of ...

You also want an ePaper? Increase the reach of your titles
YUMPU automatically turns print PDFs into web optimized ePapers that Google loves.
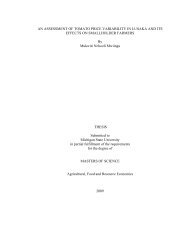
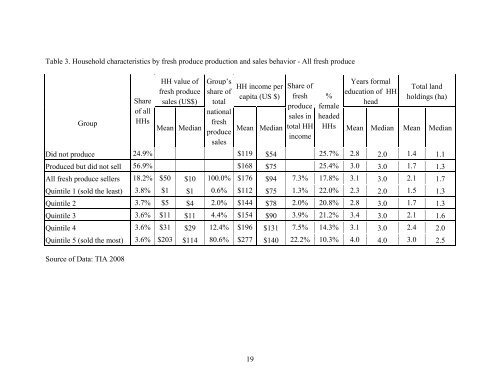
Table 3. Household characteristics by fresh produce production and sales behavi<strong>or</strong> - All fresh produce<br />
Group<br />
Share<br />
<strong>of</strong> all<br />
HH value <strong>of</strong><br />
fresh produce<br />
sales (US$)<br />
HHs Mean Median<br />
Group’s<br />
share <strong>of</strong><br />
total<br />
national<br />
fresh<br />
produce<br />
sales<br />
HH income per<br />
capita (US $)<br />
Mean Median<br />
19<br />
Share <strong>of</strong><br />
fresh<br />
produce<br />
sales in<br />
total HH<br />
income<br />
%<br />
female<br />
headed<br />
Years f<strong>or</strong>mal<br />
education <strong>of</strong> HH<br />
head<br />
Total land<br />
holdings (ha)<br />
HHs Mean Median Mean Median<br />
Did not produce 24.9% $119 $54 25.7% 2.8 2.0 1.4 1.1<br />
Produced but did not sell 56.9% $168 $75 25.4% 3.0 3.0 1.7 1.3<br />
All fresh produce sellers 18.2% $50 $10 100.0% $176 $94 7.3% 17.8% 3.1 3.0 2.1 1.7<br />
Quintile 1 (sold the least) 3.8% $1 $1 0.6% $112 $75 1.3% 22.0% 2.3 2.0 1.5 1.3<br />
Quintile 2 3.7% $5 $4 2.0% $144 $78 2.0% 20.8% 2.8 3.0 1.7 1.3<br />
Quintile 3 3.6% $11 $11 4.4% $154 $90 3.9% 21.2% 3.4 3.0 2.1 1.6<br />
Quintile 4 3.6% $31 $29 12.4% $196 $131 7.5% 14.3% 3.1 3.0 2.4 2.0<br />
Quintile 5 (sold the most) 3.6% $203 $114 80.6% $277 $140 22.2% 10.3% 4.0 4.0 3.0 2.5<br />
Source <strong>of</strong> Data: TIA 2008