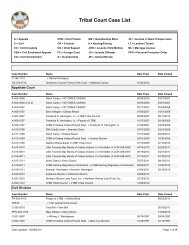
LTBB Master Land Use Plan - Little Traverse Bay Bands of Odawa ...
LTBB Master Land Use Plan - Little Traverse Bay Bands of Odawa ...
LTBB Master Land Use Plan - Little Traverse Bay Bands of Odawa ...

Create successful ePaper yourself
Turn your PDF publications into a flip-book with our unique Google optimized e-Paper software.
.<br />
School District Tabulations<br />
The summary table “<strong>LTBB</strong> Reservation – School District Tabulations by District” (Table 6) and<br />
the two graphs that accompany it (Graph 4, Graph 5) depict actual and computed data for the six<br />
school districts that have either some or all <strong>of</strong> their area within the <strong>LTBB</strong> Reservation boundaries.<br />
Actual data is for the 2002-2003 school year, as provided to www.greatschools.net and its affiliated<br />
data programs. This data can also be seen on Map Two.<br />
As can be seen from the table, the districts tabulated represent a variety <strong>of</strong> sizes and capabilities.<br />
The largest district, Public Schools <strong>of</strong> Petoskey, has over 3000 students at 7 facilities, and covers 174<br />
square miles, the second largest area <strong>of</strong> all those summarized here. This gives it an average <strong>of</strong> 433<br />
students per facility, again the second highest <strong>of</strong> those listed.<br />
Perhaps most valuably, we can see for each district the average number <strong>of</strong> students per facility,<br />
and the area in square miles that each average facility must cover. Therefore, we note, for example,<br />
that while <strong>Little</strong>field Public Schools has only one facility, that facility must service all 456 students,<br />
highest in this listing, and cover 41 square miles.<br />
This may give us an idea <strong>of</strong> the growth potential for each district as well. If, for example, there is<br />
a small number <strong>of</strong> students per facility in the district but a large area is covered, that has perhaps<br />
more potential for growth than a district that is small and built-out.<br />
On the following page are tabulations <strong>of</strong> more traditional measures <strong>of</strong> a school districts<br />
capability. For each <strong>of</strong> the six districts, we present the total number <strong>of</strong> staff in each <strong>of</strong> six categories,<br />
and compute the number <strong>of</strong> students per staff member. This is then compared against the average<br />
for the State <strong>of</strong> Michigan.<br />
Rather than comment or point out data on individual school districts, we can perhaps indicate<br />
that this data is subject to change on an annual basis, as staff are added or eliminated. As a snapshot<br />
<strong>of</strong> existing conditions, however, this information has a great deal <strong>of</strong> value in several areas. Students<br />
per teacher, or average class size, are important indicators <strong>of</strong> educational quality for most districts. In<br />
addition, related to that, is the number <strong>of</strong> administrators. The relationship between number <strong>of</strong><br />
teachers, number <strong>of</strong> administrators, and the total enrollment may indicate something about the<br />
allocation <strong>of</strong> budget dollars within the district.<br />
Population Change Tabulation<br />
The table “<strong>LTBB</strong> Reservation – Population Change Tabulation” (Table 7) and the graph that<br />
accompanies it (Graph 6) illustrate important trends in population change among, and within, the<br />
municipalities in the <strong>LTBB</strong> Reservation area. In it, we examine the total population for each MCD,<br />
given in the 1970 Census, the 1980 Census, the 1990 Census, and the 2000 Census. Thus, we have<br />
three decades <strong>of</strong> population change with which to develop trend information. This data is also<br />
displayed via Maps 3 and 4.<br />
As can be seen in the table, the vast majority <strong>of</strong> MCD’s have gained population in the 30-year<br />
time span, but not all. Several have lost population either in the last decade, or indeed every decade<br />
reviewed here. This distinction is important because, while the region as a whole is growing at a<br />
relatively fast rate, the movement <strong>of</strong> population within the region, i.e. between municipalities, will<br />
give us a better more precise idea <strong>of</strong> how to predict future growth. For example, both the City <strong>of</strong><br />
13