SYDNEY PORTS CORPORATION ANNUAL REPORT 12
SYDNEY PORTS CORPORATION ANNUAL REPORT 12
SYDNEY PORTS CORPORATION ANNUAL REPORT 12

You also want an ePaper? Increase the reach of your titles
YUMPU automatically turns print PDFs into web optimized ePapers that Google loves.
64<br />
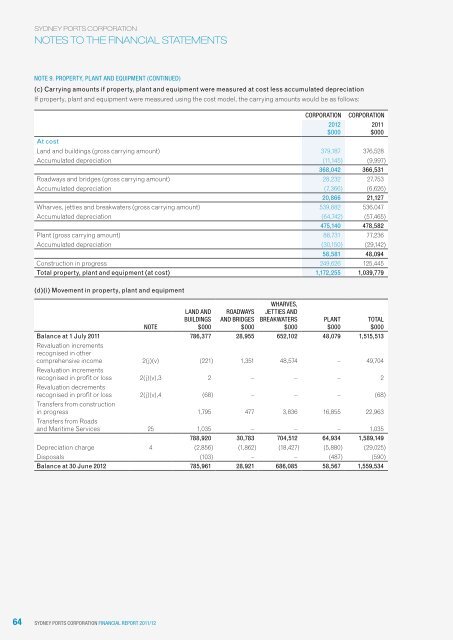
Sydney PortS CorPoration<br />
noteS to the FinanCiaL StateMentS<br />
note 9. ProPerty, Plant and eQUiPment (ContinUed)<br />
(c) Carrying amounts if property, plant and equipment were measured at cost less accumulated depreciation<br />
If property, plant and equipment were measured using the cost model, the carrying amounts would be as follows:<br />
Sydney PortS CorPoration finanCial rePort 2011/<strong>12</strong><br />
CorPoration CorPoration<br />
At cost<br />
Land and buildings (gross carrying amount) 379,187 376,528<br />
Accumulated depreciation (11,145) (9,997)<br />
368,042 366,531<br />
Roadways and bridges (gross carrying amount) 28,232 27,753<br />
Accumulated depreciation (7,366) (6,626)<br />
20,866 21,<strong>12</strong>7<br />
Wharves, jetties and breakwaters (gross carrying amount) 539,882 536,047<br />
Accumulated depreciation (64,742) (57,465)<br />
475,140 478,582<br />
Plant (gross carrying amount) 88,731 77,236<br />
Accumulated depreciation (30,150) (29,142)<br />
58,581 48,094<br />
Construction in progress 249,626 <strong>12</strong>5,445<br />
Total property, plant and equipment (at cost) 1,172,255 1,039,779<br />
(d)(i) Movement in property, plant and equipment<br />
land and roadwayS<br />
wharveS,<br />
JettieS and<br />
BUildingS and BridgeS BreakwaterS Plant total<br />
note<br />
$000 $000 $000 $000 $000<br />
Balance at 1 July 2011<br />
Revaluation increments<br />
recognised in other<br />
786,377 28,955 652,102 48,079 1,515,513<br />
comprehensive income<br />
Revaluation increments<br />
2(j)(v) (221) 1,351 48,574 – 49,704<br />
recognised in profit or loss<br />
Revaluation decrements<br />
2(j)(v),3 2 – – – 2<br />
recognised in profit or loss<br />
Transfers from construction<br />
2(j)(v),4 (68) – – – (68)<br />
in progress<br />
Transfers from Roads<br />
1,795 477 3,836 16,855 22,963<br />
and Maritime Services 25 1,035 – – – 1,035<br />
788,920 30,783 704,5<strong>12</strong> 64,934 1,589,149<br />
Depreciation charge 4 (2,856) (1,862) (18,427) (5,880) (29,025)<br />
Disposals (103) – – (487) (590)<br />
Balance at 30 June 20<strong>12</strong> 785,961 28,921 686,085 58,567 1,559,534<br />
20<strong>12</strong><br />
$000<br />
2011<br />
$000