Pediatric Neuroscience Pathways Fall 2012 - Cleveland Clinic
Pediatric Neuroscience Pathways Fall 2012 - Cleveland Clinic
Pediatric Neuroscience Pathways Fall 2012 - Cleveland Clinic

You also want an ePaper? Increase the reach of your titles
YUMPU automatically turns print PDFs into web optimized ePapers that Google loves.
cover story | diagNostic radiology<br />
Figure 5<br />
Figure 3<br />
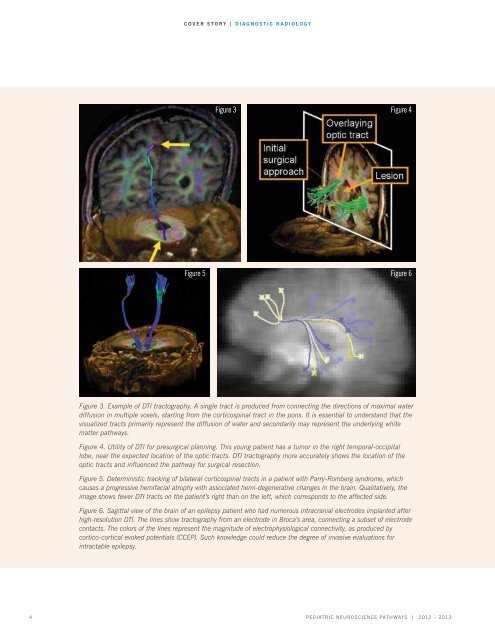
Figure 3. Example of DTI tractography. A single tract is produced from connecting the directions of maximal water<br />
diffusion in multiple voxels, starting from the corticospinal tract in the pons. It is essential to understand that the<br />
visualized tracts primarily represent the diffusion of water and secondarily may represent the underlying white<br />
matter pathways.<br />
Figure 4. Utility of DTI for presurgical planning. This young patient has a tumor in the right temporal-occipital<br />
lobe, near the expected location of the optic tracts. DTI tractography more accurately shows the location of the<br />
optic tracts and influenced the pathway for surgical resection.<br />
Figure 5. Deterministic tracking of bilateral corticospinal tracts in a patient with Parry-Romberg syndrome, which<br />
causes a progressive hemifacial atrophy with associated hemi-degenerative changes in the brain. Qualitatively, the<br />
image shows fewer DTI tracts on the patient’s right than on the left, which corresponds to the affected side.<br />
Figure 6. Sagittal view of the brain of an epilepsy patient who had numerous intracranial electrodes implanted after<br />
high-resolution DTI. The lines show tractography from an electrode in Broca’s area, connecting a subset of electrode<br />
contacts. The colors of the lines represent the magnitude of electrophysiological connectivity, as produced by<br />
cortico-cortical evoked potentials (CCEP). Such knowledge could reduce the degree of invasive evaluations for<br />
intractable epilepsy.<br />
4 <strong>Pediatric</strong> NeuroscieNce <strong>Pathways</strong> | <strong>2012</strong> – 2013<br />
Figure 4<br />
Figure 6