

2012 APTA Fact Book Appendix A - American Public Transportation ...
2012 APTA Fact Book Appendix A - American Public Transportation ...
2012 APTA Fact Book Appendix A - American Public Transportation ...

You also want an ePaper? Increase the reach of your titles
YUMPU automatically turns print PDFs into web optimized ePapers that Google loves.
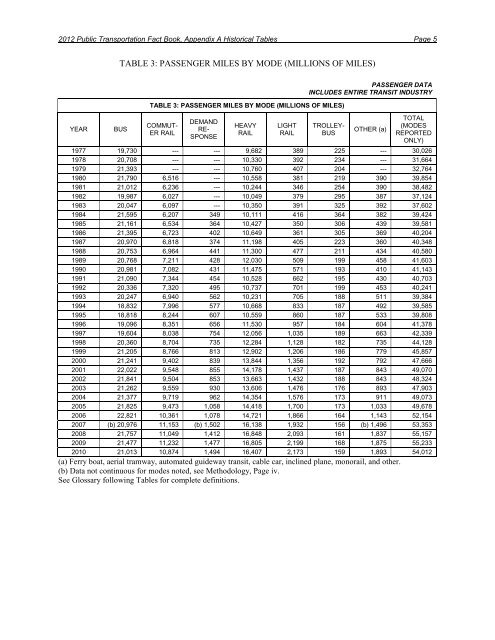
<strong>2012</strong> <strong>Public</strong> <strong>Transportation</strong> <strong>Fact</strong> <strong>Book</strong>, <strong>Appendix</strong> A Historical Tables Page 5<br />
YEAR BUS<br />
TABLE 3: PASSENGER MILES BY MODE (MILLIONS OF MILES)<br />
TABLE 3: PASSENGER MILES BY MODE (MILLIONS OF MILES)<br />
COMMUT-<br />
ER RAIL<br />
DEMAND<br />
RE-<br />
SPONSE<br />
HEAVY<br />
RAIL<br />
LIGHT<br />
RAIL<br />
PASSENGER DATA<br />
INCLUDES ENTIRE TRANSIT INDUSTRY<br />
TROLLEY-<br />
BUS<br />
OTHER (a)<br />
TOTAL<br />
(MODES<br />
REPORTED<br />
ONLY)<br />
1977 19,730 --- --- 9,682 389 225 --- 30,026<br />
1978 20,708 --- --- 10,330 392 234 --- 31,664<br />
1979 21,393 --- --- 10,760 407 204 --- 32,764<br />
1980 21,790 6,516 --- 10,558 381 219 390 39,854<br />
1981 21,012 6,236 --- 10,244 346 254 390 38,482<br />
1982 19,987 6,027 --- 10,049 379 295 387 37,124<br />
1983 20,047 6,097 --- 10,350 391 325 392 37,602<br />
1984 21,595 6,207 349 10,111 416 364 382 39,424<br />
1985 21,161 6,534 364 10,427 350 306 439 39,581<br />
1986 21,395 6,723 402 10,649 361 305 369 40,204<br />
1987 20,970 6,818 374 11,198 405 223 360 40,348<br />
1988 20,753 6,964 441 11,300 477 211 434 40,580<br />
1989 20,768 7,211 428 12,030 509 199 458 41,603<br />
1990 20,981 7,082 431 11,475 571 193 410 41,143<br />
1991 21,090 7,344 454 10,528 662 195 430 40,703<br />
1992 20,336 7,320 495 10,737 701 199 453 40,241<br />
1993 20,247 6,940 562 10,231 705 188 511 39,384<br />
1994 18,832 7,996 577 10,668 833 187 492 39,585<br />
1995 18,818 8,244 607 10,559 860 187 533 39,808<br />
1996 19,096 8,351 656 11,530 957 184 604 41,378<br />
1997 19,604 8,038 754 12,056 1,035 189 663 42,339<br />
1998 20,360 8,704 735 12,284 1,128 182 735 44,128<br />
1999 21,205 8,766 813 12,902 1,206 186 779 45,857<br />
2000 21,241 9,402 839 13,844 1,356 192 792 47,666<br />
2001 22,022 9,548 855 14,178 1,437 187 843 49,070<br />
2002 21,841 9,504 853 13,663 1,432 188 843 48,324<br />
2003 21,262 9,559 930 13,606 1,476 176 893 47,903<br />
2004 21,377 9,719 962 14,354 1,576 173 911 49,073<br />
2005 21,825 9,473 1,058 14,418 1,700 173 1,033 49,678<br />
2006 22,821 10,361 1,078 14,721 1,866 164 1,143 52,154<br />
2007 (b) 20,976 11,153 (b) 1,502 16,138 1,932 156 (b) 1,496 53,353<br />
2008 21,757 11,049 1,412 16,848 2,093 161 1,837 55,157<br />
2009 21,477 11,232 1,477 16,805 2,199 168 1,875 55,233<br />
2010 21,013 10,874 1,494 16,407 2,173 159 1,893 54,012<br />
(a) Ferry boat, aerial tramway, automated guideway transit, cable car, inclined plane, monorail, and other.<br />
(b) Data not continuous for modes noted, see Methodology, Page iv.<br />
See Glossary following Tables for complete definitions.


