

2012 APTA Fact Book Appendix A - American Public Transportation ...
2012 APTA Fact Book Appendix A - American Public Transportation ...
2012 APTA Fact Book Appendix A - American Public Transportation ...

Create successful ePaper yourself
Turn your PDF publications into a flip-book with our unique Google optimized e-Paper software.
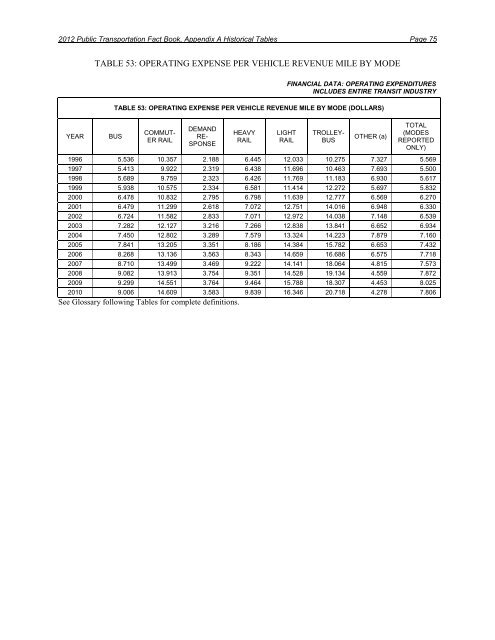
<strong>2012</strong> <strong>Public</strong> <strong>Transportation</strong> <strong>Fact</strong> <strong>Book</strong>, <strong>Appendix</strong> A Historical Tables Page 75<br />
YEAR BUS<br />
TABLE 53: OPERATING EXPENSE PER VEHICLE REVENUE MILE BY MODE<br />
FINANCIAL DATA: OPERATING EXPENDITURES<br />
INCLUDES ENTIRE TRANSIT INDUSTRY<br />
TABLE 53: OPERATING EXPENSE PER VEHICLE REVENUE MILE BY MODE (DOLLARS)<br />
COMMUT-<br />
ER RAIL<br />
DEMAND<br />
RE-<br />
SPONSE<br />
HEAVY<br />
RAIL<br />
LIGHT<br />
RAIL<br />
TROLLEY-<br />
BUS<br />
OTHER (a)<br />
TOTAL<br />
(MODES<br />
REPORTED<br />
ONLY)<br />
1996 5.536 10.357 2.188 6.445 12.033 10.275 7.327 5.569<br />
1997 5.413 9.922 2.319 6.438 11.696 10.463 7.693 5.500<br />
1998 5.689 9.759 2.323 6.426 11.769 11.183 6.930 5.617<br />
1999 5.938 10.575 2.334 6.581 11.414 12.272 5.697 5.832<br />
2000 6.478 10.832 2.795 6.798 11.639 12.777 6.569 6.270<br />
2001 6.479 11.299 2.618 7.072 12.751 14.016 6.948 6.330<br />
2002 6.724 11.582 2.833 7.071 12.972 14.038 7.148 6.539<br />
2003 7.282 12.127 3.216 7.266 12.838 13.841 6.652 6.934<br />
2004 7.450 12.802 3.289 7.579 13.324 14.223 7.879 7.160<br />
2005 7.841 13.205 3.351 8.186 14.384 15.782 6.653 7.432<br />
2006 8.268 13.136 3.563 8.343 14.659 16.686 6.575 7.718<br />
2007 8.710 13.499 3.469 9.222 14.141 18.064 4.815 7.573<br />
2008 9.082 13.913 3.754 9.351 14.528 19.134 4.559 7.872<br />
2009 9.299 14.551 3.764 9.464 15.788 18.307 4.453 8.025<br />
2010 9.006 14.609 3.583 9.839 16.346 20.718 4.278 7.806<br />
See Glossary following Tables for complete definitions.


