

2012 APTA Fact Book Appendix A - American Public Transportation ...
2012 APTA Fact Book Appendix A - American Public Transportation ...
2012 APTA Fact Book Appendix A - American Public Transportation ...

Create successful ePaper yourself
Turn your PDF publications into a flip-book with our unique Google optimized e-Paper software.
<strong>2012</strong> <strong>Public</strong> <strong>Transportation</strong> <strong>Fact</strong> <strong>Book</strong>, <strong>Appendix</strong> A Historical Tables Page 27<br />
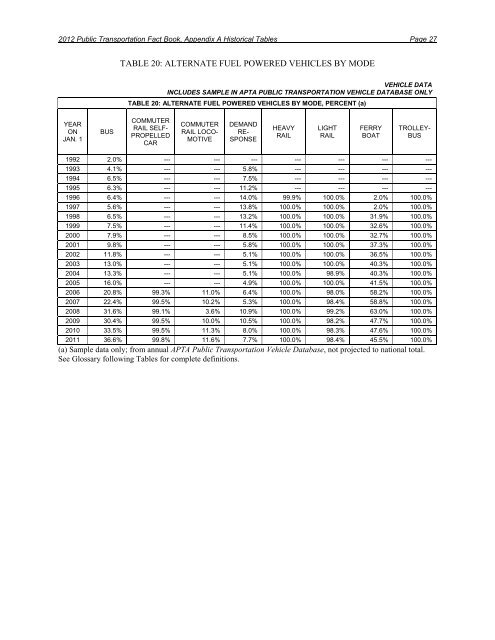
YEAR<br />
ON<br />
JAN. 1<br />
BUS<br />
TABLE 20: ALTERNATE FUEL POWERED VEHICLES BY MODE<br />
VEHICLE DATA<br />
INCLUDES SAMPLE IN <strong>APTA</strong> PUBLIC TRANSPORTATION VEHICLE DATABASE ONLY<br />
TABLE 20: ALTERNATE FUEL POWERED VEHICLES BY MODE, PERCENT (a)<br />
COMMUTER<br />
RAIL SELF-<br />
PROPELLED<br />
CAR<br />
COMMUTER<br />
RAIL LOCO-<br />
MOTIVE<br />
DEMAND<br />
RE-<br />
SPONSE<br />
HEAVY<br />
RAIL<br />
LIGHT<br />
RAIL<br />
FERRY<br />
BOAT<br />
TROLLEY-<br />
BUS<br />
1992 2.0% --- --- --- --- --- --- ---<br />
1993 4.1% --- --- 5.8% --- --- --- ---<br />
1994 6.5% --- --- 7.5% --- --- --- ---<br />
1995 6.3% --- --- 11.2% --- --- --- ---<br />
1996 6.4% --- --- 14.0% 99.9% 100.0% 2.0% 100.0%<br />
1997 5.6% --- --- 13.8% 100.0% 100.0% 2.0% 100.0%<br />
1998 6.5% --- --- 13.2% 100.0% 100.0% 31.9% 100.0%<br />
1999 7.5% --- --- 11.4% 100.0% 100.0% 32.6% 100.0%<br />
2000 7.9% --- --- 8.5% 100.0% 100.0% 32.7% 100.0%<br />
2001 9.8% --- --- 5.8% 100.0% 100.0% 37.3% 100.0%<br />
2002 11.8% --- --- 5.1% 100.0% 100.0% 36.5% 100.0%<br />
2003 13.0% --- --- 5.1% 100.0% 100.0% 40.3% 100.0%<br />
2004 13.3% --- --- 5.1% 100.0% 98.9% 40.3% 100.0%<br />
2005 16.0% --- --- 4.9% 100.0% 100.0% 41.5% 100.0%<br />
2006 20.8% 99.3% 11.0% 6.4% 100.0% 98.0% 58.2% 100.0%<br />
2007 22.4% 99.5% 10.2% 5.3% 100.0% 98.4% 58.8% 100.0%<br />
2008 31.6% 99.1% 3.6% 10.9% 100.0% 99.2% 63.0% 100.0%<br />
2009 30.4% 99.5% 10.0% 10.5% 100.0% 98.2% 47.7% 100.0%<br />
2010 33.5% 99.5% 11.3% 8.0% 100.0% 98.3% 47.6% 100.0%<br />
2011 36.6% 99.8% 11.6% 7.7% 100.0% 98.4% 45.5% 100.0%<br />
(a) Sample data only; from annual <strong>APTA</strong> <strong>Public</strong> <strong>Transportation</strong> Vehicle Database, not projected to national total.<br />
See Glossary following Tables for complete definitions.


