

2012 APTA Fact Book Appendix A - American Public Transportation ...
2012 APTA Fact Book Appendix A - American Public Transportation ...
2012 APTA Fact Book Appendix A - American Public Transportation ...

Create successful ePaper yourself
Turn your PDF publications into a flip-book with our unique Google optimized e-Paper software.
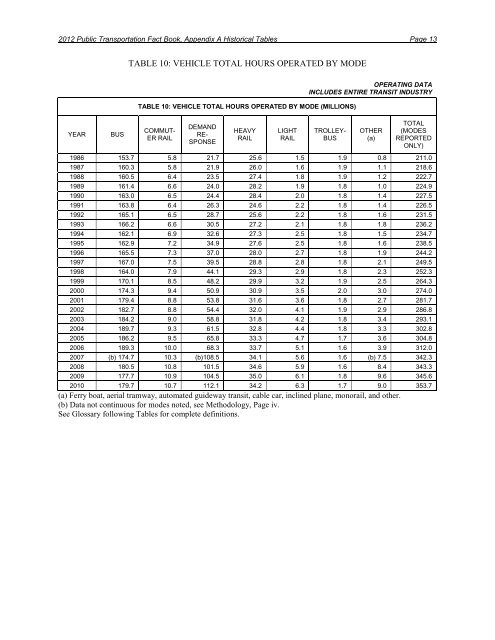
<strong>2012</strong> <strong>Public</strong> <strong>Transportation</strong> <strong>Fact</strong> <strong>Book</strong>, <strong>Appendix</strong> A Historical Tables Page 13<br />
YEAR BUS<br />
TABLE 10: VEHICLE TOTAL HOURS OPERATED BY MODE<br />
TABLE 10: VEHICLE TOTAL HOURS OPERATED BY MODE (MILLIONS)<br />
COMMUT-<br />
ER RAIL<br />
DEMAND<br />
RE-<br />
SPONSE<br />
HEAVY<br />
RAIL<br />
LIGHT<br />
RAIL<br />
OPERATING DATA<br />
INCLUDES ENTIRE TRANSIT INDUSTRY<br />
TROLLEY-<br />
BUS<br />
OTHER<br />
(a)<br />
TOTAL<br />
(MODES<br />
REPORTED<br />
ONLY)<br />
1986 153.7 5.8 21.7 25.6 1.5 1.9 0.8 211.0<br />
1987 160.3 5.8 21.9 26.0 1.6 1.9 1.1 218.6<br />
1988 160.5 6.4 23.5 27.4 1.8 1.9 1.2 222.7<br />
1989 161.4 6.6 24.0 28.2 1.9 1.8 1.0 224.9<br />
1990 163.0 6.5 24.4 28.4 2.0 1.8 1.4 227.5<br />
1991 163.8 6.4 26.3 24.6 2.2 1.8 1.4 226.5<br />
1992 165.1 6.5 28.7 25.6 2.2 1.8 1.6 231.5<br />
1993 166.2 6.6 30.5 27.2 2.1 1.8 1.8 236.2<br />
1994 162.1 6.9 32.6 27.3 2.5 1.8 1.5 234.7<br />
1995 162.9 7.2 34.9 27.6 2.5 1.8 1.6 238.5<br />
1996 165.5 7.3 37.0 28.0 2.7 1.8 1.9 244.2<br />
1997 167.0 7.5 39.5 28.8 2.8 1.8 2.1 249.5<br />
1998 164.0 7.9 44.1 29.3 2.9 1.8 2.3 252.3<br />
1999 170.1 8.5 48.2 29.9 3.2 1.9 2.5 264.3<br />
2000 174.3 9.4 50.9 30.9 3.5 2.0 3.0 274.0<br />
2001 179.4 8.8 53.8 31.6 3.6 1.8 2.7 281.7<br />
2002 182.7 8.8 54.4 32.0 4.1 1.9 2.9 286.8<br />
2003 184.2 9.0 58.8 31.8 4.2 1.8 3.4 293.1<br />
2004 189.7 9.3 61.5 32.8 4.4 1.8 3.3 302.8<br />
2005 186.2 9.5 65.8 33.3 4.7 1.7 3.6 304.8<br />
2006 189.3 10.0 68.3 33.7 5.1 1.6 3.9 312.0<br />
2007 (b) 174.7 10.3 (b)108.5 34.1 5.6 1.6 (b) 7.5 342.3<br />
2008 180.5 10.8 101.5 34.6 5.9 1.6 8.4 343.3<br />
2009 177.7 10.9 104.5 35.0 6.1 1.8 9.6 345.6<br />
2010 179.7 10.7 112.1 34.2 6.3 1.7 9.0 353.7<br />
(a) Ferry boat, aerial tramway, automated guideway transit, cable car, inclined plane, monorail, and other.<br />
(b) Data not continuous for modes noted, see Methodology, Page iv.<br />
See Glossary following Tables for complete definitions.


