2012 APTA Fact Book Appendix A - American Public Transportation ...
2012 APTA Fact Book Appendix A - American Public Transportation ...
2012 APTA Fact Book Appendix A - American Public Transportation ...
Create successful ePaper yourself
Turn your PDF publications into a flip-book with our unique Google optimized e-Paper software.
<strong>2012</strong> <strong>Public</strong> <strong>Transportation</strong> <strong>Fact</strong> <strong>Book</strong>,<br />
<strong>Appendix</strong> A: Historical Tables viii<br />
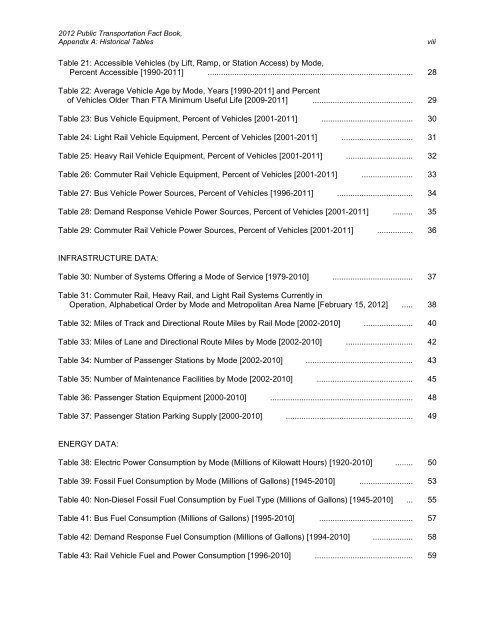
Table 21: Accessible Vehicles (by Lift, Ramp, or Station Access) by Mode,<br />
Percent Accessible [1990-2011] ............................................................................................ 28<br />
Table 22: Average Vehicle Age by Mode, Years [1990-2011] and Percent<br />
of Vehicles Older Than FTA Minimum Useful Life [2009-2011] ............................................. 29<br />
Table 23: Bus Vehicle Equipment, Percent of Vehicles [2001-2011] ......................................... 30<br />
Table 24: Light Rail Vehicle Equipment, Percent of Vehicles [2001-2011] ................................ 31<br />
Table 25: Heavy Rail Vehicle Equipment, Percent of Vehicles [2001-2011] .............................. 32<br />
Table 26: Commuter Rail Vehicle Equipment, Percent of Vehicles [2001-2011] ....................... 33<br />
Table 27: Bus Vehicle Power Sources, Percent of Vehicles [1996-2011] .................................. 34<br />
Table 28: Demand Response Vehicle Power Sources, Percent of Vehicles [2001-2011] ......... 35<br />
Table 29: Commuter Rail Vehicle Power Sources, Percent of Vehicles [2001-2011] ................ 36<br />
INFRASTRUCTURE DATA:<br />
Table 30: Number of Systems Offering a Mode of Service [1979-2010] .................................... 37<br />
Table 31: Commuter Rail, Heavy Rail, and Light Rail Systems Currently in<br />
Operation, Alphabetical Order by Mode and Metropolitan Area Name [February 15, <strong>2012</strong>] ..... 38<br />
Table 32: Miles of Track and Directional Route Miles by Rail Mode [2002-2010] ...................... 40<br />
Table 33: Miles of Lane and Directional Route Miles by Mode [2002-2010] .............................. 42<br />
Table 34: Number of Passenger Stations by Mode [2002-2010] ................................................ 43<br />
Table 35: Number of Maintenance Facilities by Mode [2002-2010] ........................................... 45<br />
Table 36: Passenger Station Equipment [2000-2010] ................................................................ 48<br />
Table 37: Passenger Station Parking Supply [2000-2010] ......................................................... 49<br />
ENERGY DATA:<br />
Table 38: Electric Power Consumption by Mode (Millions of Kilowatt Hours) [1920-2010] ........ 50<br />
Table 39: Fossil Fuel Consumption by Mode (Millions of Gallons) [1945-2010] ........................ 53<br />
Table 40: Non-Diesel Fossil Fuel Consumption by Fuel Type (Millions of Gallons) [1945-2010] ... 55<br />
Table 41: Bus Fuel Consumption (Millions of Gallons) [1995-2010] .......................................... 57<br />
Table 42: Demand Response Fuel Consumption (Millions of Gallons) [1994-2010] .................. 58<br />
Table 43: Rail Vehicle Fuel and Power Consumption [1996-2010] ............................................ 59


