

2012 APTA Fact Book Appendix A - American Public Transportation ...
2012 APTA Fact Book Appendix A - American Public Transportation ...
2012 APTA Fact Book Appendix A - American Public Transportation ...

Create successful ePaper yourself
Turn your PDF publications into a flip-book with our unique Google optimized e-Paper software.
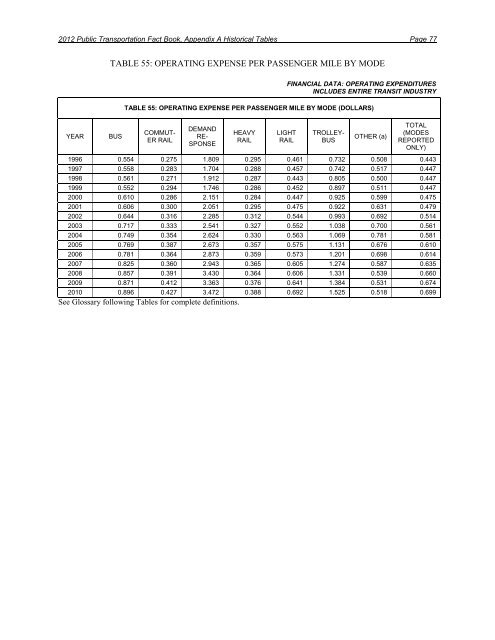
<strong>2012</strong> <strong>Public</strong> <strong>Transportation</strong> <strong>Fact</strong> <strong>Book</strong>, <strong>Appendix</strong> A Historical Tables Page 77<br />
YEAR BUS<br />
TABLE 55: OPERATING EXPENSE PER PASSENGER MILE BY MODE<br />
FINANCIAL DATA: OPERATING EXPENDITURES<br />
INCLUDES ENTIRE TRANSIT INDUSTRY<br />
TABLE 55: OPERATING EXPENSE PER PASSENGER MILE BY MODE (DOLLARS)<br />
COMMUT-<br />
ER RAIL<br />
DEMAND<br />
RE-<br />
SPONSE<br />
HEAVY<br />
RAIL<br />
LIGHT<br />
RAIL<br />
TROLLEY-<br />
BUS<br />
OTHER (a)<br />
TOTAL<br />
(MODES<br />
REPORTED<br />
ONLY)<br />
1996 0.554 0.275 1.809 0.295 0.461 0.732 0.508 0.443<br />
1997 0.558 0.283 1.704 0.288 0.457 0.742 0.517 0.447<br />
1998 0.561 0.271 1.912 0.287 0.443 0.805 0.500 0.447<br />
1999 0.552 0.294 1.746 0.286 0.452 0.897 0.511 0.447<br />
2000 0.610 0.286 2.151 0.284 0.447 0.925 0.599 0.475<br />
2001 0.606 0.300 2.051 0.295 0.475 0.922 0.631 0.479<br />
2002 0.644 0.316 2.285 0.312 0.544 0.993 0.692 0.514<br />
2003 0.717 0.333 2.541 0.327 0.552 1.038 0.700 0.561<br />
2004 0.749 0.354 2.624 0.330 0.563 1.069 0.781 0.581<br />
2005 0.769 0.387 2.673 0.357 0.575 1.131 0.676 0.610<br />
2006 0.781 0.364 2.873 0.359 0.573 1.201 0.698 0.614<br />
2007 0.825 0.360 2.943 0.365 0.605 1.274 0.587 0.635<br />
2008 0.857 0.391 3.430 0.364 0.606 1.331 0.539 0.660<br />
2009 0.871 0.412 3.363 0.376 0.641 1.384 0.531 0.674<br />
2010 0.896 0.427 3.472 0.388 0.692 1.525 0.518 0.699<br />
See Glossary following Tables for complete definitions.


