VMware vCenter CapacityIQ Evaluator's Guide - VMware Communities
VMware vCenter CapacityIQ Evaluator's Guide - VMware Communities
VMware vCenter CapacityIQ Evaluator's Guide - VMware Communities

Create successful ePaper yourself
Turn your PDF publications into a flip-book with our unique Google optimized e-Paper software.
E valuator’s guidE<br />
vmware vCeNTer CapaCiT yiQ<br />
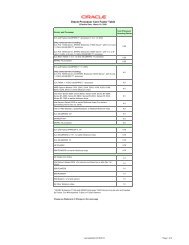
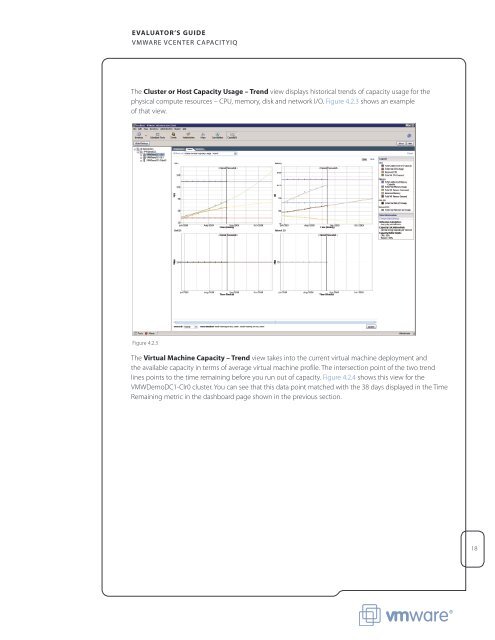
The Cluster or Host Capacity usage – trend view displays historical trends of capacity usage for the<br />
physical compute resources – CPU, memory, disk and network I/O. Figure 4.2.3 shows an example<br />
of that view.<br />
Figure 4.2.3<br />
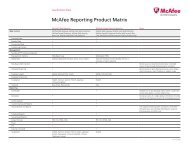
The virtual Machine Capacity – trend view takes into the current virtual machine deployment and<br />
the available capacity in terms of average virtual machine profile. The intersection point of the two trend<br />
lines points to the time remaining before you run out of capacity. Figure 4.2.4 shows this view for the<br />
VMWDemoDC1-Clr0 cluster. You can see that this data point matched with the 38 days displayed in the Time<br />
Remaining metric in the dashboard page shown in the previous section.<br />
18