Tpl2 Kinase Is Upregulated in Adipose Tissue in Obesity ... - Diabetes
Tpl2 Kinase Is Upregulated in Adipose Tissue in Obesity ... - Diabetes
Tpl2 Kinase Is Upregulated in Adipose Tissue in Obesity ... - Diabetes

You also want an ePaper? Increase the reach of your titles
YUMPU automatically turns print PDFs into web optimized ePapers that Google loves.
<strong>Tpl2</strong> AND CYTOKINE ACTION IN ADIPOCYTES<br />
A<br />
B<br />
<strong>Tpl2</strong> L<br />
<strong>Tpl2</strong> S<br />
tubul<strong>in</strong><br />
<strong>Tpl2</strong> prote<strong>in</strong> amount<br />
(Percent of Control)<br />
C<br />
<strong>Tpl2</strong> L<br />
<strong>Tpl2</strong> S<br />
ERK1<br />
ERK2<br />
<strong>Tpl2</strong> L<br />
<strong>Tpl2</strong> S<br />
tubul<strong>in</strong><br />
<strong>Tpl2</strong> amount<br />
(Percent of Basal)<br />
IL-1β:<br />
(m<strong>in</strong>)<br />
140<br />
120<br />
100<br />
80<br />
60<br />
40<br />
20<br />
0<br />
IL-1β:<br />
(m<strong>in</strong>)<br />
140<br />
120<br />
100<br />
80<br />
60<br />
40<br />
20<br />
0<br />
fibro adipo macro<br />
<strong>Tpl2</strong> prote<strong>in</strong> amount<br />
(Relative Expression)<br />
0 10 20 30 45 60 90<br />
** *** **<br />
0 10 20 30 45 60 90<br />
controlIKKβ <strong>in</strong>hibitor<br />
basal<br />
IL-1β<br />
TNF-α<br />
basal<br />
IL-1β<br />
TNF-α<br />
***<br />
**<br />
control IKKβ <strong>in</strong>hibitor<br />
†<br />
2.5<br />
2.0 *<br />
6<br />
5<br />
*<br />
1.5<br />
1.0<br />
4<br />
3<br />
2<br />
0.5<br />
1<br />
0<br />
fibro adipo<br />
0<br />
fibro adipo<br />
*<br />
‡<br />
<strong>Tpl2</strong> prote<strong>in</strong> amount<br />
(Percent of Control)<br />
<strong>Tpl2</strong>L <strong>Tpl2</strong>S ERK1<br />
ERK2<br />
<strong>Tpl2</strong> L<br />
<strong>Tpl2</strong> S<br />
TNF-α:<br />
(m<strong>in</strong>)<br />
140<br />
120<br />
100<br />
80<br />
60<br />
40<br />
20<br />
0<br />
TNF-α:<br />
(m<strong>in</strong>)<br />
tubul<strong>in</strong><br />
<strong>Tpl2</strong> amount<br />
(Percent of Basal)<br />
140<br />
120<br />
100<br />
80<br />
60<br />
40<br />
20<br />
0<br />
<strong>Tpl2</strong> mRNA level<br />
(Relative Expression)<br />
0 10 20 30 45 60 90<br />
*<br />
**<br />
***<br />
** **<br />
0 10 20 30 45 60 90<br />
basal<br />
control MG132<br />
IL-1β<br />
TNF-α<br />
* *<br />
basal<br />
IL-1β<br />
control MG-132<br />
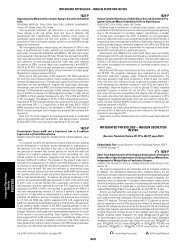
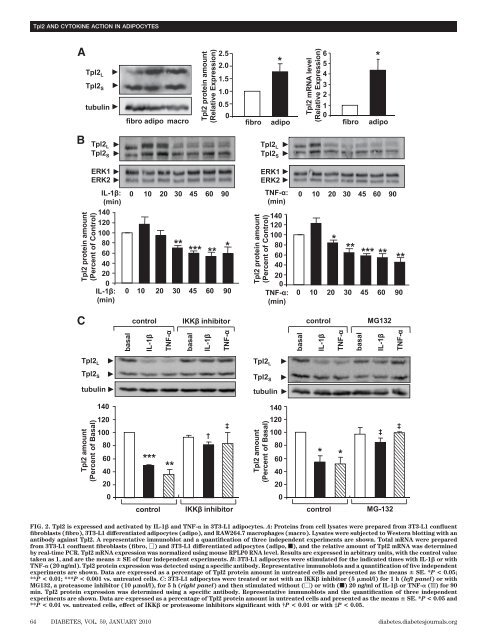
FIG. 2. <strong>Tpl2</strong> is expressed and activated by IL-1 and TNF- <strong>in</strong> 3T3-L1 adipocytes. A: Prote<strong>in</strong>s from cell lysates were prepared from 3T3-L1 confluent<br />
fibroblasts (fibro), 3T3-L1 differentiated adipocytes (adipo), and RAW264.7 macrophages (macro). Lysates were subjected to Western blott<strong>in</strong>g with an<br />
antibody aga<strong>in</strong>st <strong>Tpl2</strong>. A representative immunoblot and a quantification of three <strong>in</strong>dependent experiments are shown. Total mRNA were prepared<br />
from 3T3-L1 confluent fibroblasts (fibro, ) and 3T3-L1 differentiated adipocytes (adipo, f), and the relative amount of <strong>Tpl2</strong> mRNA was determ<strong>in</strong>ed<br />
by real-time PCR. <strong>Tpl2</strong> mRNA expression was normalized us<strong>in</strong>g mouse RPLP0 RNA level. Results are expressed <strong>in</strong> arbitrary units, with the control value<br />
taken as 1, and are the means SE of four <strong>in</strong>dependent experiments. B: 3T3-L1 adipocytes were stimulated for the <strong>in</strong>dicated times with IL-1 or with<br />
TNF- (20 ng/ml). <strong>Tpl2</strong> prote<strong>in</strong> expression was detected us<strong>in</strong>g a specific antibody. Representative immunoblots and a quantification of five <strong>in</strong>dependent<br />
experiments are shown. Data are expressed as a percentage of <strong>Tpl2</strong> prote<strong>in</strong> amount <strong>in</strong> untreated cells and presented as the means SE. *P < 0.05;<br />
**P < 0.01; ***P < 0.001 vs. untreated cells. C: 3T3-L1 adipocytes were treated or not with an IKK <strong>in</strong>hibitor (5 mol/l) for 1 h (left panel) or with<br />
MG132, a proteasome <strong>in</strong>hibitor (10 mol/l), for 5h(right panel) and then stimulated without () or with (f) 20 ng/ml of IL-1 or TNF- (p) for 90<br />
m<strong>in</strong>. <strong>Tpl2</strong> prote<strong>in</strong> expression was determ<strong>in</strong>ed us<strong>in</strong>g a specific antibody. Representative immunoblots and the quantification of three <strong>in</strong>dependent<br />
experiments are shown. Data are expressed as a percentage of <strong>Tpl2</strong> prote<strong>in</strong> amount <strong>in</strong> untreated cells and presented as the means SE. *P < 0.05 and<br />
**P < 0.01 vs. untreated cells, effect of IKK or proteasome <strong>in</strong>hibitors significant with †P < 0.01 or with ‡P < 0.05.<br />
64 DIABETES, VOL. 59, JANUARY 2010 diabetes.diabetesjournals.org<br />
‡<br />
TNF-α<br />
‡