Tpl2 Kinase Is Upregulated in Adipose Tissue in Obesity ... - Diabetes
Tpl2 Kinase Is Upregulated in Adipose Tissue in Obesity ... - Diabetes
Tpl2 Kinase Is Upregulated in Adipose Tissue in Obesity ... - Diabetes

You also want an ePaper? Increase the reach of your titles
YUMPU automatically turns print PDFs into web optimized ePapers that Google loves.
<strong>Tpl2</strong> AND CYTOKINE ACTION IN ADIPOCYTES<br />
A<br />
<strong>Tpl2</strong> L<br />
<strong>Tpl2</strong> S<br />
C<br />
tub<br />
P-MEK/MEK<br />
(Fold over Basal)<br />
P-ERK/ERK<br />
(Fold over Basal)<br />
siCTR<br />
20<br />
16<br />
12<br />
8<br />
4<br />
0<br />
25<br />
20<br />
15<br />
10<br />
5<br />
0<br />
si<strong>Tpl2</strong><br />
B<br />
basal<br />
**<br />
basal IL-1β<br />
basal IL-1β<br />
siCTR si<strong>Tpl2</strong><br />
IL-1β<br />
TNF-α<br />
TNF-α<br />
TNF-α<br />
<strong>in</strong>sul<strong>in</strong><br />
<strong>in</strong>sul<strong>in</strong><br />
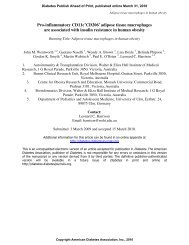
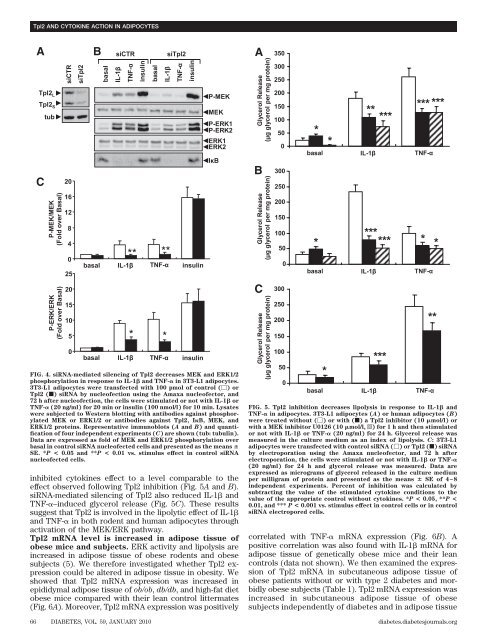
<strong>in</strong>hibited cytok<strong>in</strong>es effect to a level comparable to the<br />
effect observed follow<strong>in</strong>g <strong>Tpl2</strong> <strong>in</strong>hibition (Fig. 5A and B).<br />
siRNA-mediated silenc<strong>in</strong>g of <strong>Tpl2</strong> also reduced IL-1 and<br />
TNF-–<strong>in</strong>duced glycerol release (Fig. 5C). These results<br />
suggest that <strong>Tpl2</strong> is <strong>in</strong>volved <strong>in</strong> the lipolytic effect of IL-1<br />
and TNF- <strong>in</strong> both rodent and human adipocytes through<br />
activation of the MEK/ERK pathway.<br />
<strong>Tpl2</strong> mRNA level is <strong>in</strong>creased <strong>in</strong> adipose tissue of<br />
obese mice and subjects. ERK activity and lipolysis are<br />
<strong>in</strong>creased <strong>in</strong> adipose tissue of obese rodents and obese<br />
subjects (5). We therefore <strong>in</strong>vestigated whether <strong>Tpl2</strong> expression<br />
could be altered <strong>in</strong> adipose tissue <strong>in</strong> obesity. We<br />
showed that <strong>Tpl2</strong> mRNA expression was <strong>in</strong>creased <strong>in</strong><br />
epididymal adipose tissue of ob/ob, db/db, and high-fat diet<br />
obese mice compared with their lean control littermates<br />
(Fig. 6A). Moreover, <strong>Tpl2</strong> mRNA expression was positively<br />
<strong>in</strong>sul<strong>in</strong><br />
basal<br />
IL-1β<br />
**<br />
* *<br />
TNF-α<br />
<strong>in</strong>sul<strong>in</strong><br />
P-MEK<br />
MEK<br />
P-ERK1<br />
P-ERK2<br />
ERK1<br />
ERK2<br />
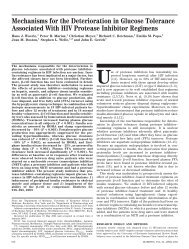
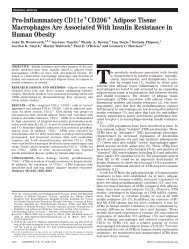
FIG. 4. siRNA-mediated silenc<strong>in</strong>g of <strong>Tpl2</strong> decreases MEK and ERK1/2<br />
phosphorylation <strong>in</strong> response to IL-1 and TNF- <strong>in</strong> 3T3-L1 adipocytes.<br />
3T3-L1 adipocytes were transfected with 100 pmol of control () or<br />
<strong>Tpl2</strong> (f) siRNA by nucleofection us<strong>in</strong>g the Amaxa nucleofector, and<br />
72 h after nucleofection, the cells were stimulated or not with IL-1 or<br />
TNF- (20 ng/ml) for 20 m<strong>in</strong> or <strong>in</strong>sul<strong>in</strong> (100 nmol/l) for 10 m<strong>in</strong>. Lysates<br />
were subjected to Western blott<strong>in</strong>g with antibodies aga<strong>in</strong>st phosphorylated<br />
MEK or ERK1/2 or antibodies aga<strong>in</strong>st <strong>Tpl2</strong>, IB, MEK, and<br />
ERK1/2 prote<strong>in</strong>s. Representative immunoblots (A and B) and quantification<br />
of four <strong>in</strong>dependent experiments (C) are shown (tub: tubul<strong>in</strong>).<br />
Data are expressed as fold of MEK and ERK1/2 phosphorylation over<br />
basal <strong>in</strong> control siRNA nucleofected cells and presented as the means <br />
SE. *P < 0.05 and **P < 0.01 vs. stimulus effect <strong>in</strong> control siRNA<br />
nucleofected cells.<br />
IκB<br />
A<br />
Glycerol Release<br />
(µg glycerol per mg prote<strong>in</strong>)<br />
B<br />
Glycerol Release<br />
(µg glycerol per mg prote<strong>in</strong>)<br />
C<br />
Glycerol Release<br />
(µg glycerol per mg prote<strong>in</strong>)<br />
350<br />
300<br />
250<br />
200<br />
150<br />
100<br />
50<br />
0<br />
300<br />
250<br />
200<br />
150<br />
100<br />
50<br />
0<br />
300<br />
250<br />
200<br />
150<br />
100<br />
50<br />
0<br />
*<br />
basal IL-1β<br />
TNF-α<br />
*<br />
*<br />
** ***<br />
*** ***<br />
basal IL-1β<br />
TNF-α<br />
*<br />
***<br />
*** * *<br />
***<br />
basal IL-1β<br />
TNF-α<br />
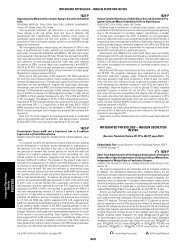
FIG. 5. <strong>Tpl2</strong> <strong>in</strong>hibition decreases lipolysis <strong>in</strong> response to IL-1 and<br />
TNF- <strong>in</strong> adipocytes. 3T3-L1 adipocytes (A) or human adipocytes (B)<br />
were treated without () or with (f) a <strong>Tpl2</strong> <strong>in</strong>hibitor (10 mol/l) or<br />
with a MEK <strong>in</strong>hibitor U0126 (10 mol/l, o) for 1 h and then stimulated<br />
or not with IL-1 or TNF- (20 ng/ml) for 24 h. Glycerol release was<br />
measured <strong>in</strong> the culture medium as an <strong>in</strong>dex of lipolysis. C: 3T3-L1<br />
adipocytes were transfected with control siRNA () or <strong>Tpl2</strong> (f) siRNA<br />
by electroporation us<strong>in</strong>g the Amaxa nucleofector, and 72 h after<br />
electroporation, the cells were stimulated or not with IL-1 or TNF-<br />
(20 ng/ml) for 24 h and glycerol release was measured. Data are<br />
expressed as micrograms of glycerol released <strong>in</strong> the culture medium<br />
per milligram of prote<strong>in</strong> and presented as the means SE of 4–8<br />
<strong>in</strong>dependent experiments. Percent of <strong>in</strong>hibition was calculated by<br />
subtract<strong>in</strong>g the value of the stimulated cytok<strong>in</strong>e conditions to the<br />
value of the appropriate control without cytok<strong>in</strong>es. *P < 0.05, **P <<br />
0.01, and *** P < 0.001 vs. stimulus effect <strong>in</strong> control cells or <strong>in</strong> control<br />
siRNA electropored cells.<br />
correlated with TNF- mRNA expression (Fig. 6B). A<br />
positive correlation was also found with IL-1 mRNA for<br />
adipose tissue of genetically obese mice and their lean<br />
controls (data not shown). We then exam<strong>in</strong>ed the expression<br />
of <strong>Tpl2</strong> mRNA <strong>in</strong> subcutaneous adipose tissue of<br />
obese patients without or with type 2 diabetes and morbidly<br />
obese subjects (Table 1). <strong>Tpl2</strong> mRNA expression was<br />
<strong>in</strong>creased <strong>in</strong> subcutaneous adipose tissue of obese<br />
subjects <strong>in</strong>dependently of diabetes and <strong>in</strong> adipose tissue<br />
66 DIABETES, VOL. 59, JANUARY 2010 diabetes.diabetesjournals.org<br />
**