Tpl2 Kinase Is Upregulated in Adipose Tissue in Obesity ... - Diabetes
Tpl2 Kinase Is Upregulated in Adipose Tissue in Obesity ... - Diabetes
Tpl2 Kinase Is Upregulated in Adipose Tissue in Obesity ... - Diabetes

Create successful ePaper yourself
Turn your PDF publications into a flip-book with our unique Google optimized e-Paper software.
A<br />
P-ERK1<br />
P-ERK2<br />
B<br />
P-ERK/ERK<br />
(Fold over Basal)<br />
C<br />
ERK1<br />
ERK2<br />
30<br />
25<br />
20<br />
15<br />
10<br />
5<br />
0<br />
P-ERK1<br />
P-ERK2<br />
ERK1<br />
ERK2<br />
basal<br />
basal<br />
basal<br />
control <strong>Tpl2</strong> <strong>in</strong>hibitor<br />
<strong>in</strong>sul<strong>in</strong><br />
<strong>in</strong>sul<strong>in</strong><br />
<strong>in</strong>sul<strong>in</strong><br />
IL-1β TNF-α<br />
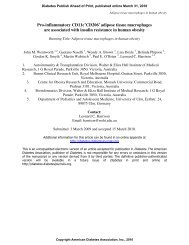
on ERK1/2 phosphorylation (Fig. 3A and B). The same<br />
results were obta<strong>in</strong>ed for MEK phosphorylation (data<br />
not shown). In contrast, activation of JNK1/2 and p38<br />
were not modified (supplementary Fig. S1A [available at<br />
http://diabetes.diabetesjournals.org/cgi/content/full/db09-0470/<br />
DC1]). Importantly, <strong>in</strong>sul<strong>in</strong> effects on ERK1/2 (Fig. 3A and<br />
B) and on prote<strong>in</strong> k<strong>in</strong>ase B (PKB) phosphorylation were<br />
not modified (supplementary Fig. S1A). In human adipocytes,<br />
pharmacological <strong>in</strong>hibition of <strong>Tpl2</strong> also <strong>in</strong>hibited<br />
ERK1/2 activation <strong>in</strong>duced by IL-1 and TNF-, whereas<br />
<strong>in</strong>sul<strong>in</strong> effect was not significantly modified (Fig. 3C).<br />
Activation of ERK1/2 promotes IRS-1 ser<strong>in</strong>e phosphorylation<br />
(31), and, among the different ser<strong>in</strong>e residues,<br />
ser<strong>in</strong>e 632 is located <strong>in</strong> a MAP k<strong>in</strong>ase consensus phosphorylation<br />
site. We showed that the phosphorylation of IRS-1<br />
on ser<strong>in</strong>e 632 <strong>in</strong>duced by IL-1 or TNF- treatment was<br />
strongly prevented when cells were pretreated with the<br />
<strong>Tpl2</strong> <strong>in</strong>hibitor (Fig. 3D and E). As expected, U0126 <strong>in</strong>hibited<br />
cytok<strong>in</strong>e-<strong>in</strong>duced IRS-1 ser<strong>in</strong>e phosphorylation (Fig.<br />
3D and E).<br />
We then used siRNA aga<strong>in</strong>st <strong>Tpl2</strong> to confirm its implication<br />
<strong>in</strong> ERK1/2 activation <strong>in</strong> response to <strong>in</strong>flammatory<br />
IL-1β<br />
IL-1β<br />
TNF-α<br />
TNF-α<br />
basal<br />
<strong>in</strong>sul<strong>in</strong><br />
IL-1β<br />
control <strong>Tpl2</strong> <strong>in</strong>hibitor<br />
basal<br />
<strong>in</strong>sul<strong>in</strong><br />
**<br />
IL-1β<br />
TNF-α<br />
TNF-α<br />
*<br />
D<br />
E<br />
IP: IRS-1<br />
P-Ser632 /IRS-1<br />
(Fold over Basal)<br />
3.5<br />
3.0<br />
2.5<br />
2.0<br />
1.5<br />
1.0<br />
0.5<br />
0<br />
control<br />
basal<br />
IL-1β<br />
TNF-α<br />
*<br />
*<br />
<strong>Tpl2</strong><br />
<strong>in</strong>hibitor<br />
basal<br />
pSer 632<br />
cytok<strong>in</strong>es. Transfection of siRNA aga<strong>in</strong>st <strong>Tpl2</strong> achieved<br />
80% efficiency <strong>in</strong> reduc<strong>in</strong>g endogenous <strong>Tpl2</strong> prote<strong>in</strong><br />
levels (Fig. 4A). <strong>Tpl2</strong> knockdown markedly decreased<br />
MEK and ERK1/2 phosphorylation <strong>in</strong>duced by IL-1 or<br />
TNF- (Fig. 4B). In contrast, <strong>Tpl2</strong> silenc<strong>in</strong>g did not modify<br />
cytok<strong>in</strong>e-<strong>in</strong>duced IB degradation (Fig. 4B) or JNK1/2 or<br />
p38 phosphorylation (supplementary Fig. S1B), <strong>in</strong>dicat<strong>in</strong>g<br />
that the observed effects did not result from a general<br />
<strong>in</strong>hibitory effect on cytok<strong>in</strong>e signal<strong>in</strong>g. Furthermore, <strong>Tpl2</strong><br />
siRNA did not affect the ability of <strong>in</strong>sul<strong>in</strong> to <strong>in</strong>duce<br />
MEK/ERK phosphorylation (Fig. 4B and C) or PKB phosphorylation<br />
(supplementary Fig. S1B).<br />
<strong>Tpl2</strong> is <strong>in</strong>volved <strong>in</strong> IL-1 and TNF-–<strong>in</strong>duced lipolysis.<br />
Pro<strong>in</strong>flammatory cytok<strong>in</strong>es <strong>in</strong>crease lipolysis <strong>in</strong> adipocytes<br />
via activation of the MAP k<strong>in</strong>ase family (10). We<br />
determ<strong>in</strong>ed whether <strong>Tpl2</strong> <strong>in</strong>hibition modified the lipolytic<br />
effect of TNF- or IL-1 by measur<strong>in</strong>g glycerol release as<br />
an <strong>in</strong>dex of lipolysis. The absolute stimulatory effect of<br />
IL-1 and TNF- on glycerol release was decreased by 56<br />
and 63%, respectively, <strong>in</strong> 3T3-L1 adipocytes (Fig. 5A) and<br />
by 85% <strong>in</strong> human adipocytes (Fig. 5B). MEK <strong>in</strong>hibition by<br />
U0126 treatment slightly decreased basal lipolysis and<br />
IL-1β<br />
TNF-α<br />
*<br />
J. JAGER AND ASSOCIATES<br />
basal<br />
**<br />
U0126<br />
IL-1β<br />
TNF-α<br />
basal IL1-β TNF-α<br />
*<br />
*<br />
IRS-1<br />
FIG. 3. Pharmacological <strong>in</strong>hibition of <strong>Tpl2</strong> decreases ERK1/2 phosphorylation<br />
and IRS-1 ser<strong>in</strong>e phosphorylation <strong>in</strong> response to IL-1 and<br />
TNF- <strong>in</strong> adipocytes. A and B: 3T3-L1 adipocytes were treated without<br />
() or with (f) a <strong>Tpl2</strong> <strong>in</strong>hibitor (30 mol/l) for 1 h and then stimulated<br />
or not with IL-1 or TNF- (20 ng/ml) for 20 m<strong>in</strong> or <strong>in</strong>sul<strong>in</strong> (100 nmol/l)<br />
for 10 m<strong>in</strong>. Lysates were subjected to Western blott<strong>in</strong>g with antibodies<br />
aga<strong>in</strong>st phosphorylated or total ERK1/2. Representative immunoblots<br />
and quantification of five <strong>in</strong>dependent experiments are shown. Data are<br />
expressed as fold of ERK1/2 phosphorylation over basal <strong>in</strong> control cells<br />
and presented as the means SE. *P < 0.01 and **P < 0.001 vs. stimulus<br />
effect <strong>in</strong> control cells. C: Human adipocytes were treated or not with a<br />
<strong>Tpl2</strong> <strong>in</strong>hibitor (20 mol/l) for 30 m<strong>in</strong> and then stimulated or not with<br />
IL-1, TNF-, or <strong>in</strong>sul<strong>in</strong> as described <strong>in</strong> A. ERK1/2 phosphorylation and<br />
ERK1/2 total prote<strong>in</strong> amount were analyzed as described above. Representative immunoblots of three <strong>in</strong>dependent experiments are shown. D and<br />
E: 3T3-L1 adipocytes were treated without () or with (f) a <strong>Tpl2</strong> <strong>in</strong>hibitor (30 mol/l), or with a MEK <strong>in</strong>hibitor U0126 (10 mol/l, p) for1h<br />
and then stimulated or not with IL-1 or TNF- (20 ng/ml) for 20 m<strong>in</strong>. Prote<strong>in</strong>s were immunoprecipited (IP) with anti–IRS-1 antibody, resolved<br />
by SDS-PAGE, and immunoblotted with a phosphospecific antibody aga<strong>in</strong>st ser<strong>in</strong>e 632 (pSer 632 ). The membrane was stripped and probed us<strong>in</strong>g<br />
anti–IRS-1 antibody. Representative immunoblots and quantification of three <strong>in</strong>dependent experiments are shown. Results were normalized for<br />
the amount of IRS-1 present <strong>in</strong> the immunoprecipitation and are the means SE. *P < 0.05 and **P < 0.01 vs. stimulus effect <strong>in</strong> control cells.<br />
diabetes.diabetesjournals.org DIABETES, VOL. 59, JANUARY 2010 65