

Indian-Fertilizer-Scenario - Department of Fertilizers
Indian-Fertilizer-Scenario - Department of Fertilizers
Indian-Fertilizer-Scenario - Department of Fertilizers

You also want an ePaper? Increase the reach of your titles
YUMPU automatically turns print PDFs into web optimized ePapers that Google loves.
name <strong>of</strong> }<br />
Company/Unit<br />
Cooperative Sector<br />
department <strong>of</strong> fertilizers ministry <strong>of</strong> chemicals & fertilizers<br />
Table -10<br />
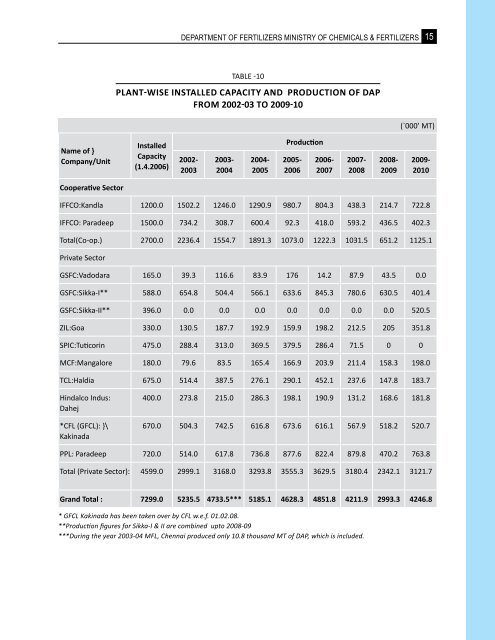
PlaNT-WiSe iNSTalleD CaPaCiTY aND ProDUCTioN oF DaP<br />
From 2002-03 To 2009-10<br />
installed<br />
Capacity<br />
(1.4.2006)<br />
2002-<br />
2003<br />
2003-<br />
2004<br />
2004-<br />
2005<br />
Production<br />
2005-<br />
2006<br />
2006-<br />
2007<br />
2007-<br />
2008<br />
2008-<br />
2009<br />
15<br />
(`000’ MT)<br />
2009-<br />
2010<br />
IFFCO:Kandla 1200.0 1502.2 1246.0 1290.9 980.7 804.3 438.3 214.7 722.8<br />
IFFCO: Paradeep 1500.0 734.2 308.7 600.4 92.3 418.0 593.2 436.5 402.3<br />
Total(Co-op.) 2700.0 2236.4 1554.7 1891.3 1073.0 1222.3 1031.5 651.2 1125.1<br />
Private Sector<br />
GSFC:Vadodara 165.0 39.3 116.6 83.9 176 14.2 87.9 43.5 0.0<br />
GSFC:Sikka-I** 588.0 654.8 504.4 566.1 633.6 845.3 780.6 630.5 401.4<br />
GSFC:Sikka-II** 396.0 0.0 0.0 0.0 0.0 0.0 0.0 0.0 520.5<br />
ZIl:Goa 330.0 130.5 187.7 192.9 159.9 198.2 212.5 205 351.8<br />
SPIC:Tuticorin 475.0 288.4 313.0 369.5 379.5 286.4 71.5 0 0<br />
MCF:Mangalore 180.0 79.6 83.5 165.4 166.9 203.9 211.4 158.3 198.0<br />
TCl:Haldia 675.0 514.4 387.5 276.1 290.1 452.1 237.6 147.8 183.7<br />
Hindalco Indus:<br />
Dahej<br />
*CFl (GFCl): }\<br />
Kakinada<br />
400.0 273.8 215.0 286.3 198.1 190.9 131.2 168.6 181.8<br />
670.0 504.3 742.5 616.8 673.6 616.1 567.9 518.2 520.7<br />
PPl: Paradeep 720.0 514.0 617.8 736.8 877.6 822.4 879.8 470.2 763.8<br />
Total (Private Sector): 4599.0 2999.1 3168.0 3293.8 3555.3 3629.5 3180.4 2342.1 3121.7<br />
Grand total : 7299.0 5235.5 4733.5*** 5185.1 4628.3 4851.8 4211.9 2993.3 4246.8<br />
* GFCL Kakinada has been taken over by CFL w.e.f. 01.02.08.<br />
**Production figures for Sikka-I & II are combined upto 2008-09<br />
***During the year 2003-04 MFL, Chennai produced only 10.8 thousand MT <strong>of</strong> DAP, which is included.