

Indian-Fertilizer-Scenario - Department of Fertilizers
Indian-Fertilizer-Scenario - Department of Fertilizers
Indian-Fertilizer-Scenario - Department of Fertilizers

Create successful ePaper yourself
Turn your PDF publications into a flip-book with our unique Google optimized e-Paper software.
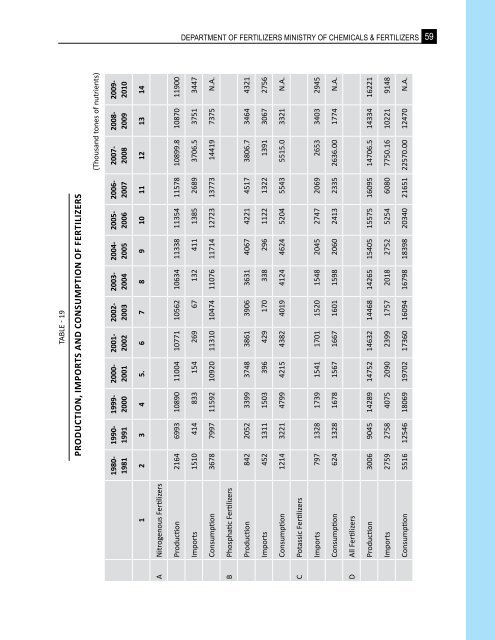
Table - 19<br />
PRodUCtion, iMPoRts And ConsUMPtion oF FeRtiLiZeRs<br />
(Thousand tones <strong>of</strong> nutrients)<br />
2009-<br />
2010<br />
2008-<br />
2009<br />
2007-<br />
2008<br />
2006-<br />
2007<br />
2005-<br />
2006<br />
2004-<br />
2005<br />
2003-<br />
2004<br />
2002-<br />
2003<br />
2001-<br />
2002<br />
2000-<br />
2001<br />
1999-<br />
2000<br />
1990-<br />
1991<br />
1980-<br />
1981<br />
1 2 3 4 5. 6 7 8 9 10 11 12 13 14<br />
a Nitrogenous <strong>Fertilizer</strong>s<br />
Production 2164 6993 10890 11004 10771 10562 10634 11338 11354 11578 10899.8 10870 11900<br />
department <strong>of</strong> fertilizers ministry <strong>of</strong> chemicals & fertilizers<br />
imports 1510 414 833 154 269 67 132 411 1385 2689 3706.5 3751 3447<br />
Consumption 3678 7997 11592 10920 11310 10474 11076 11714 12723 13773 14419 7375 N.a.<br />
b Phosphatic <strong>Fertilizer</strong>s<br />
Production 842 2052 3399 3748 3861 3906 3631 4067 4221 4517 3806.7 3464 4321<br />
imports 452 1311 1503 396 429 170 338 296 1122 1322 1391 3067 2756<br />
Consumption 1214 3221 4799 4215 4382 4019 4124 4624 5204 5543 5515.0 3321 N.a.<br />
c Potassic <strong>Fertilizer</strong>s<br />
imports 797 1328 1739 1541 1701 1520 1548 2045 2747 2069 2653 3403 2945<br />
Consumption 624 1328 1678 1567 1667 1601 1598 2060 2413 2335 2636.00 1774 N.a.<br />
D all <strong>Fertilizer</strong>s<br />
Production 3006 9045 14289 14752 14632 14468 14265 15405 15575 16095 14706.5 14334 16221<br />
imports 2759 2758 4075 2090 2399 1757 2018 2752 5254 6080 7750.16 10221 9148<br />
Consumption 5516 12546 18069 19702 17360 16094 16798 18398 20340 21651 22570.00 12470 N.a.<br />
59