

Indian-Fertilizer-Scenario - Department of Fertilizers
Indian-Fertilizer-Scenario - Department of Fertilizers
Indian-Fertilizer-Scenario - Department of Fertilizers

Create successful ePaper yourself
Turn your PDF publications into a flip-book with our unique Google optimized e-Paper software.
62 indian fertilizer scenario 2010<br />
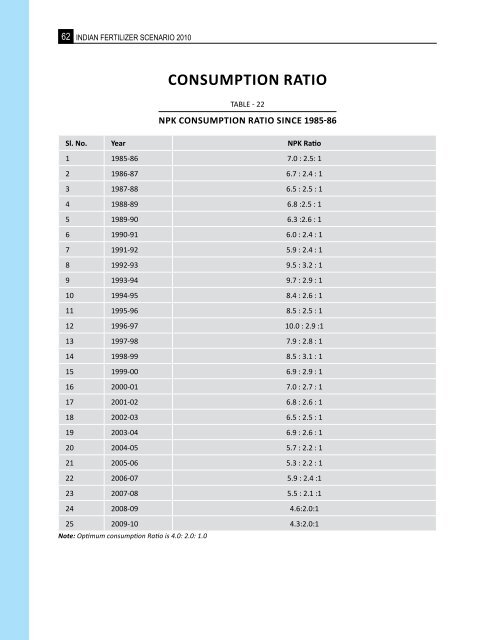
ConsUMPtion RAtio<br />
Table - 22<br />
NPK CoNSUmPTioN raTio SiNCe 1985-86<br />
sl. no. Year NPK ratio<br />
1 1985-86 7.0 : 2.5: 1<br />
2 1986-87 6.7 : 2.4 : 1<br />
3 1987-88 6.5 : 2.5 : 1<br />
4 1988-89 6.8 :2.5 : 1<br />
5 1989-90 6.3 :2.6 : 1<br />
6 1990-91 6.0 : 2.4 : 1<br />
7 1991-92 5.9 : 2.4 : 1<br />
8 1992-93 9.5 : 3.2 : 1<br />
9 1993-94 9.7 : 2.9 : 1<br />
10 1994-95 8.4 : 2.6 : 1<br />
11 1995-96 8.5 : 2.5 : 1<br />
12 1996-97 10.0 : 2.9 :1<br />
13 1997-98 7.9 : 2.8 : 1<br />
14 1998-99 8.5 : 3.1 : 1<br />
15 1999-00 6.9 : 2.9 : 1<br />
16 2000-01 7.0 : 2.7 : 1<br />
17 2001-02 6.8 : 2.6 : 1<br />
18 2002-03 6.5 : 2.5 : 1<br />
19 2003-04 6.9 : 2.6 : 1<br />
20 2004-05 5.7 : 2.2 : 1<br />
21 2005-06 5.3 : 2.2 : 1<br />
22 2006-07 5.9 : 2.4 :1<br />
23 2007-08 5.5 : 2.1 :1<br />
24 2008-09 4.6:2.0:1<br />
25 2009-10 4.3:2.0:1<br />
Note: Optimum consumption Ratio is 4.0: 2.0: 1.0