

Indian-Fertilizer-Scenario - Department of Fertilizers
Indian-Fertilizer-Scenario - Department of Fertilizers
Indian-Fertilizer-Scenario - Department of Fertilizers

You also want an ePaper? Increase the reach of your titles
YUMPU automatically turns print PDFs into web optimized ePapers that Google loves.
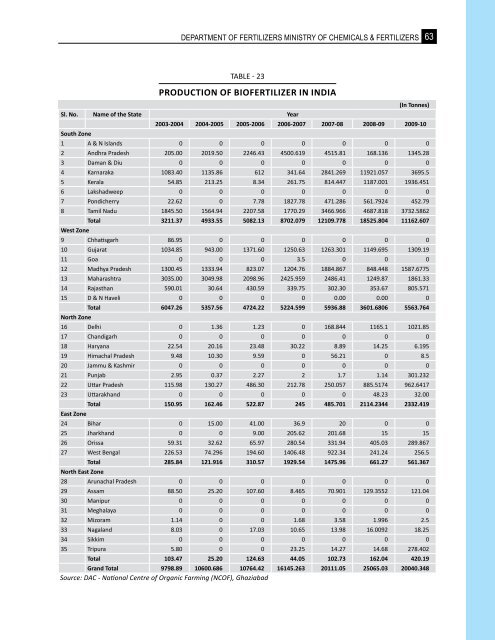
department <strong>of</strong> fertilizers ministry <strong>of</strong> chemicals & fertilizers<br />
Table - 23<br />
PRodUCtion oF BioFeRtiLiZeR in indiA<br />
sl. no. name <strong>of</strong> the state Year<br />
63<br />
(in tonnes)<br />
2003-2004 2004-2005 2005-2006 2006-2007 2007-08 2008-09 2009-10<br />
south Zone<br />
1 a & N Islands 0 0 0 0 0 0 0<br />
2 andhra Pradesh 205.00 2019.50 2246.43 4500.619 4515.81 168.136 1345.28<br />
3 Daman & Diu 0 0 0 0 0 0 0<br />
4 Karnaraka 1083.40 1135.86 612 341.64 2841.269 11921.057 3695.5<br />
5 Kerala 54.85 213.25 8.34 261.75 814.447 1187.001 1936.451<br />
6 lakshadweep 0 0 0 0 0 0 0<br />
7 Pondicherry 22.62 0 7.78 1827.78 471.286 561.7924 452.79<br />
8 tamil nadu 1845.50 1564.94 2207.58 1770.29 3466.966 4687.818 3732.5862<br />
total 3211.37 4933.55 5082.13 8702.079 12109.778 18525.804 11162.607<br />
west Zone<br />
9 Chhatisgarh 86.95 0 0 0 0 0 0<br />
10 gujarat 1034.85 943.00 1371.60 1250.63 1263.301 1149.695 1309.19<br />
11 goa 0 0 0 3.5 0 0 0<br />
12 Madhya Pradesh 1300.45 1333.94 823.07 1204.76 1884.867 848.448 1587.6775<br />
13 Maharashtra 3035.00 3049.98 2098.96 2425.959 2486.41 1249.87 1861.33<br />
14 Rajasthan 590.01 30.64 430.59 339.75 302.30 353.67 805.571<br />
15 D & N Haveli 0 0 0 0 0.00 0.00 0<br />
total 6047.26 5357.56 4724.22 5224.599 5936.88 3601.6806 5563.764<br />
north Zone<br />
16 Delhi 0 1.36 1.23 0 168.844 1165.1 1021.85<br />
17 Chandigarh 0 0 0 0 0 0 0<br />
18 Haryana 22.54 20.16 23.48 30.22 8.89 14.25 6.195<br />
19 Himachal Pradesh 9.48 10.30 9.59 0 56.21 0 8.5<br />
20 Jammu & Kashmir 0 0 0 0 0 0 0<br />
21 Punjab 2.95 0.37 2.27 2 1.7 1.14 301.232<br />
22 Uttar Pradesh 115.98 130.27 486.30 212.78 250.057 885.5174 962.6417<br />
23 Uttarakhand 0 0 0 0 0 48.23 32.00<br />
total 150.95 162.46 522.87 245 485.701 2114.2344 2332.419<br />
east Zone<br />
24 bihar 0 15.00 41.00 36.9 20 0 0<br />
25 Jharkhand 0 0 9.00 205.62 201.68 15 15<br />
26 orissa 59.31 32.62 65.97 280.54 331.94 405.03 289.867<br />
27 West bengal 226.53 74.296 194.60 1406.48 922.34 241.24 256.5<br />
total 285.84 121.916 310.57 1929.54 1475.96 661.27 561.367<br />
north east Zone<br />
28 arunachal Pradesh 0 0 0 0 0 0 0<br />
29 assam 88.50 25.20 107.60 8.465 70.901 129.3552 121.04<br />
30 Manipur 0 0 0 0 0 0 0<br />
31 Meghalaya 0 0 0 0 0 0 0<br />
32 Mizoram 1.14 0 0 1.68 3.58 1.996 2.5<br />
33 Nagaland 8.03 0 17.03 10.65 13.98 16.0092 18.25<br />
34 sikkim 0 0 0 0 0 0 0<br />
35 tripura 5.80 0 0 23.25 14.27 14.68 278.402<br />
total 103.47 25.20 124.63 44.05 102.73 162.04 420.19<br />
Grand total 9798.89 10600.686 10764.42 16145.263 20111.05 25065.03 20040.348<br />
Source: DAC - National Centre <strong>of</strong> Organic Farming (NCOF), Ghaziabad