

Indian-Fertilizer-Scenario - Department of Fertilizers
Indian-Fertilizer-Scenario - Department of Fertilizers
Indian-Fertilizer-Scenario - Department of Fertilizers

Create successful ePaper yourself
Turn your PDF publications into a flip-book with our unique Google optimized e-Paper software.
20 indian fertilizer scenario 2010<br />
Sector<br />
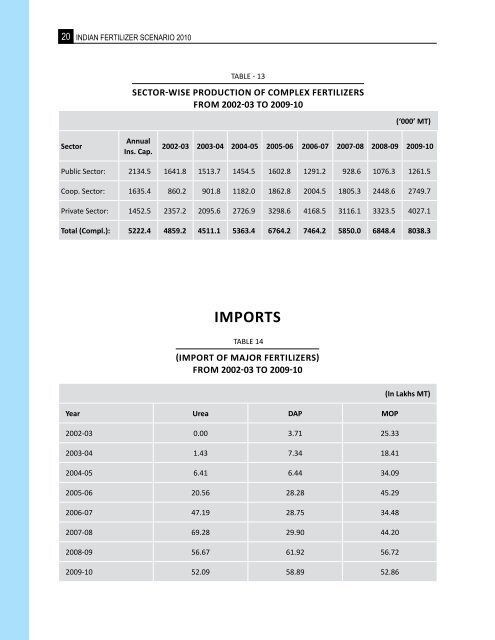
Table - 13<br />
SeCTor-WiSe ProDUCTioN oF ComPleX FerTiliZerS<br />
From 2002-03 To 2009-10<br />
Annual<br />
ins. Cap.<br />
(‘000’ Mt)<br />
2002-03 2003-04 2004-05 2005-06 2006-07 2007-08 2008-09 2009-10<br />
Public Sector: 2134.5 1641.8 1513.7 1454.5 1602.8 1291.2 928.6 1076.3 1261.5<br />
Coop. Sector: 1635.4 860.2 901.8 1182.0 1862.8 2004.5 1805.3 2448.6 2749.7<br />
Private Sector: 1452.5 2357.2 2095.6 2726.9 3298.6 4168.5 3116.1 3323.5 4027.1<br />
total (Compl.): 5222.4 4859.2 4511.1 5363.4 6764.2 7464.2 5850.0 6848.4 8038.3<br />
iMPoRts<br />
table 14<br />
(imPorT oF major FerTiliZerS)<br />
From 2002-03 To 2009-10<br />
Year Urea dAP MoP<br />
2002-03 0.00 3.71 25.33<br />
2003-04 1.43 7.34 18.41<br />
2004-05 6.41 6.44 34.09<br />
2005-06 20.56 28.28 45.29<br />
2006-07 47.19 28.75 34.48<br />
2007-08 69.28 29.90 44.20<br />
2008-09 56.67 61.92 56.72<br />
2009-10 52.09 58.89 52.86<br />
(in Lakhs Mt)