Table-17 (Contd...) stAtewise, MontHwise AVAiLABitY And sALes oF DaP DUriNg rabi 2009-10 october - 2009 november - 2009 December - 2009 January - 2010 February - 2010 Mar - 2010 state Availability sales Availability sales Availability sales Availability sales Availability sales Availability sales andaman & Nicobar 0.00 0.00 0.00 0.00 0.00 0.00 0.00 0.00 0.00 0.00 500.00 500.00 andhra Pradesh 114,478.65 88,616.40 118,816.60 75,501.50 80,671.85 54,841.80 43,576.35 39,655.10 11,804.15 10,336.45 50,287.45 46,643.15 arunachal Pradesh 0.00 0.00 0.00 0.00 0.00 0.00 0.00 0.00 0.00 0.00 0.00 0.00 assam 2,585.90 2,580.40 2,452.40 2,439.25 3,676.60 3,322.35 274.25 268.75 5.50 0.00 0.00 0.00 bihar 54,565.55 49,735.90 96,598.10 81,714.70 85,196.60 76,041.65 19,291.20 17,382.20 9,276.90 9,071.10 10,368.80 10,173.00 department <strong>of</strong> fertilizers ministry <strong>of</strong> chemicals & fertilizers Chandigarh 0.00 0.00 0.00 0.00 0.00 0.00 0.00 0.00 0.00 0.00 0.00 0.00 Chattisgarh 11,486.67 9,018.55 5,959.97 5,349.70 5,868.07 5,703.90 3,875.77 3,834.25 3,101.12 3,059.60 59,225.70 59,209.90 Dadra & Nagar Haveli 63.35 2.60 60.75 16.95 193.80 171.90 51.90 30.85 146.05 30.40 115.65 111.75 Daman & Diu 0.00 0.00 0.00 0.00 0.00 0.00 10.00 10.00 0.00 0.00 0.00 0.00 Delhi 0.00 0.00 500.00 500.00 0.00 0.00 0.00 0.00 0.00 0.00 0.00 0.00 goa 50.00 50.00 40.00 40.00 360.00 325.00 144.00 144.00 307.00 278.00 156.00 156.00 gujarat 101,943.61 71,615.21 112,849.28 80,389.38 68,696.01 37,838.97 43,015.64 19,826.61 63,666.68 40,285.57 57,940.75 56,074.62 Harayana 153,925.65 149,243.75 107,313.50 105,959.25 17,860.40 17,619.30 241.10 128.10 2,751.85 2,696.15 15,864.90 15,845.55 Himachal Pradesh 0.00 0.00 0.00 0.00 0.00 0.00 0.00 0.00 0.00 0.00 0.00 0.00 J&K 3,496.85 3,460.30 7,972.05 7,953.65 5,319.05 4,432.00 887.05 32.80 3,492.10 2,752.35 6,021.35 5,611.70 Jharkhand 14,955.65 13,377.65 10,597.10 6,669.45 9,111.80 8,563.20 1,545.80 1,545.80 1,312.80 1,312.80 4,048.40 4,048.40 Karnataka 34,330.35 24,185.60 58,998.75 47,296.70 34,139.30 27,146.95 24,119.90 20,043.81 48,316.84 41,170.45 103,841.89 103,694.24 Kerala 3,178.90 3,111.30 4,193.80 3,519.05 1,646.70 1,556.10 1,120.60 1,096.50 1,328.10 1,320.50 1,507.60 1,507.60 lakshadweep 0.00 0.00 0.00 0.00 0.00 0.00 0.00 0.00 0.00 0.00 0.00 0.00 Madhya Pradesh 107,111.90 83,296.55 210,067.75 139,439.70 96,859.50 81,918.85 17,918.45 7,629.15 17,536.90 8,558.75 39,371.70 34,289.80 Maharashtra 58,508.34 55,634.75 90,208.14 75,668.60 82,875.14 69,175.80 33,312.34 15,719.45 47,254.39 38,242.25 133,715.95 133,446.90 Manipur 0.00 0.00 80.00 0.00 80.00 80.00 0.00 0.00 0.00 0.00 0.00 0.00 Megalaya 0.00 0.00 0.00 0.00 0.00 0.00 0.00 0.00 0.00 0.00 0.00 0.00 Mizoram 0.00 0.00 0.00 0.00 0.00 0.00 0.00 0.00 0.00 0.00 0.00 0.00 Nagaland 0.00 0.00 0.00 0.00 0.00 0.00 0.00 0.00 0.00 0.00 0.00 0.00 orissa 20,463.97 7,382.85 22,189.32 5,687.70 25,040.02 14,515.75 25,476.27 15,635.25 17,099.37 10,410.85 13,146.27 11,050.30 Pondicherry 905.00 905.00 271.65 271.65 0.00 0.00 0.00 0.00 0.00 0.00 0.00 0.00 Punjab 178,068.75 175,803.00 117,770.90 115,921.05 12,280.50 11,371.50 909.00 167.00 8,868.45 8,027.25 13,394.50 12,921.35 Rajasthan 133,935.95 132,593.20 113,610.11 101,754.50 33,086.86 21,891.15 11,346.46 2,077.35 9,657.61 3,709.45 8,913.00 8,873.35 sikkim 0.00 0.00 0.00 0.00 0.00 0.00 0.00 0.00 0.00 0.00 0.00 0.00 tamil nadu 30,530.95 27,802.15 51,050.70 49,919.35 8,877.25 8,708.40 10,331.95 10,219.80 3,743.00 3,635.95 26,887.70 26,797.75 tripura 0.00 0.00 0.00 0.00 0.00 0.00 0.00 0.00 0.00 0.00 0.00 0.00 Uttar Pradesh 209,793.45 199,442.80 363,739.05 342,927.35 233,416.60 219,632.90 17,551.70 11,726.70 19,712.80 17,380.10 112,213.05 110,863.10 Uttarakhand 1,586.85 1,406.55 8,600.00 7,322.15 3,933.85 3,392.55 793.50 449.05 344.45 325.85 518.60 501.90 West bengal 33,116.09 32,812.95 60,734.44 55,462.00 50,746.50 42,992.90 58,686.95 50,913.00 21,519.85 18,540.70 21,525.57 20,539.90 total 1,269,082.38 1,132,077.46 1,564,674.35 1,311,723.63 859,936.38 711,242.92 314,480.17 218,535.52 291,245.90 221,144.52 679,564.83 662,860.26 51
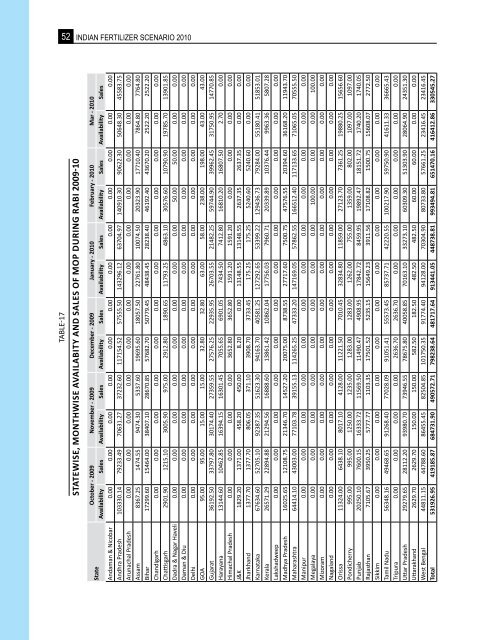
52 indian fertilizer scenario 2010 Table-17 stAtewise, MontHwise AVAiLABitY And sALes oF moP DUriNg rabi 2009-10 october - 2009 november - 2009 December - 2009 January - 2010 February - 2010 Mar - 2010 state Availability sales Availability sales Availability sales Availability sales Availability sales Availability sales andaman & Nicobar 0.00 0.00 0.00 0.00 0.00 0.00 0.00 0.00 0.00 0.00 0.00 0.00 andhra Pradesh 103330.14 79233.49 70631.27 37232.60 117154.52 57555.50 143296.12 63704.97 140910.30 90622.30 50648.30 45583.75 arunachal Pradesh 0.00 0.00 0.00 0.00 0.00 0.00 0.00 0.00 0.00 0.00 0.00 0.00 assam 8367.25 1474.55 9474.30 5337.60 19695.60 18057.50 22761.80 10074.50 20323.90 17710.40 7864.80 7764.80 bihar 17299.60 15464.00 38407.10 28670.85 57682.70 50779.45 48438.45 28238.40 46192.40 43670.20 2522.20 2522.20 Chandigarh 0.00 0.00 0.00 0.00 0.00 0.00 0.00 0.00 0.00 0.00 0.00 0.00 Chattisgarh 2901.90 1215.10 3005.90 975.00 2912.80 1890.65 11793.25 4863.10 30576.60 10790.90 19785.70 13901.85 Dadra & Nagar Haveli 0.00 0.00 0.00 0.00 0.00 0.00 0.00 0.00 50.00 50.00 0.00 0.00 Daman & Diu 0.00 0.00 0.00 0.00 0.00 0.00 0.00 0.00 0.00 0.00 0.00 0.00 Delhi 0.00 0.00 0.00 0.00 0.00 0.00 0.00 0.00 0.00 0.00 0.00 0.00 goa 95.00 95.00 15.00 15.00 32.80 32.80 63.00 58.00 238.00 198.00 43.00 43.00 gujarat 36192.50 33797.80 30174.40 27359.55 27576.25 22935.95 26703.55 21482.25 59744.90 39962.45 31750.95 14770.85 Harayana 13144.60 10462.85 16394.15 16301.45 7055.65 6901.05 7434.50 7412.80 16810.20 16807.50 2.70 0.00 Himachal Pradesh 0.00 0.00 0.00 0.00 3652.80 3652.80 1591.20 1591.20 0.00 0.00 0.00 0.00 J&K 1829.20 1371.00 458.20 450.00 8.20 0.00 13148.55 13148.55 2637.35 2637.35 0.00 0.00 Jharkhand 1377.70 1377.70 806.05 371.10 3908.70 3733.45 175.25 175.25 5240.60 5240.60 0.00 0.00 Karnataka 67634.60 52705.10 92387.35 51623.30 94163.70 40581.25 127292.65 53399.22 129436.73 79284.00 55180.41 51853.01 Kerala 26571.29 22894.88 21294.56 16888.60 13861.42 10862.04 17756.03 7960.71 20339.89 10376.44 9963.36 5807.28 lakshadweep 0.00 0.00 0.00 0.00 0.00 0.00 0.00 0.00 0.00 0.00 0.00 0.00 Madhya Pradesh 16025.65 12108.75 21346.70 14527.20 20075.00 8738.55 27717.60 7500.75 47576.55 20394.60 36168.20 11943.70 Maharashtra 64414.10 43003.00 77103.78 39155.13 114265.25 47333.20 147169.05 57862.55 166512.40 117133.65 71065.05 70555.50 Manipur 0.00 0.00 0.00 0.00 0.00 0.00 0.00 0.00 0.00 0.00 0.00 0.00 Megalaya 0.00 0.00 0.00 0.00 0.00 0.00 0.00 0.00 100.00 0.00 0.00 100.00 Mizoram 0.00 0.00 0.00 0.00 0.00 0.00 0.00 0.00 0.00 0.00 0.00 0.00 Nagaland 0.00 0.00 0.00 0.00 0.00 0.00 0.00 0.00 0.00 0.00 0.00 0.00 orissa 11324.00 6438.10 8017.10 4128.00 11221.50 7010.45 32834.80 11859.00 27123.70 7361.25 19880.25 15656.60 Pondicherry 995.00 995.00 1250.00 1235.00 1283.00 1283.00 1262.00 755.00 1359.00 802.00 1097.00 1097.00 Punjab 20250.10 7600.15 16333.72 11569.50 11490.47 4908.95 17842.72 8459.95 19892.47 18151.72 1740.20 1740.05 Rajasthan 7105.67 3950.25 5777.77 1103.35 17501.52 5235.15 15649.23 3911.56 17108.82 1500.75 15608.07 2772.50 sikkim 0.00 0.00 0.00 0.00 0.00 0.00 0.00 0.00 0.00 0.00 0.00 0.00 tamil nadu 56348.16 49468.65 91268.40 77028.09 91051.41 55573.45 85737.71 42220.55 100217.90 59750.90 41611.33 36665.43 tripura 0.00 0.00 0.00 0.00 2636.70 2636.70 0.00 0.00 0.00 0.00 0.00 0.00 Uttar Pradesh 29279.65 28112.20 93980.70 73946.55 78675.80 40058.85 70163.10 33273.10 60309.30 51303.90 28064.90 24351.30 Uttarakhand 2629.70 2629.70 150.00 150.00 582.50 182.50 482.50 482.50 60.00 60.00 0.00 0.00 West bengal 44811.15 44788.60 86455.45 82504.85 101750.35 91774.40 94128.00 70304.90 80733.80 57661.25 23416.45 23416.45 total 531926.95 419185.87 684731.90 490572.71 798238.64 481717.64 913441.05 448738.81 993494.81 651470.16 416412.86 330545.27
- Page 2 and 3:
IndIan fertIlIzer scenario 2 0 1 0
- Page 4 and 5:
srikant kumar jena Message The grow
- Page 6 and 7:
department of fertilizers ministry
- Page 8 and 9:
department of fertilizers ministry
- Page 10 and 11: Sl. No. State/Name of the Plant and
- Page 12 and 13: department of fertilizers ministry
- Page 14 and 15: 49 Shree Datta Fertilizers & Chemic
- Page 16 and 17: department of fertilizers ministry
- Page 18 and 19: 15 13 14 6 12 9 1 department of fer
- Page 20 and 21: THE FERTILIZER SECTOR
- Page 22 and 23: 10 indian fertilizer scenario 2010
- Page 24 and 25: department of fertilizers ministry
- Page 26 and 27: name of } Company/Unit Cooperative
- Page 28 and 29: (‘000’ MT) Production Product N
- Page 30 and 31: Product department of fertilizers m
- Page 32 and 33: table 15 PorT-WiSe imPorT oF FerTil
- Page 34 and 35: department of fertilizers ministry
- Page 36 and 37: , department of fertilizers ministr
- Page 38 and 39: , department of fertilizers ministr
- Page 40 and 41: , department of fertilizers ministr
- Page 42 and 43: department of fertilizers ministry
- Page 44 and 45: STATEWISE, MONTHWISE AVAILABILITY A
- Page 46 and 47: department of fertilizers ministry
- Page 48 and 49: STATEWISE, MONTHWISE AVAILABILITY A
- Page 50 and 51: STATEWISE, MONTHWISE AVAILABILITY A
- Page 52 and 53: STATEWISE, MONTHWISE AVAILABILITY A
- Page 54 and 55: STATEWISE, MONTHWISE AVAILABILITY A
- Page 56 and 57: Table -17 (Contd...) stAtewise, Mon
- Page 58 and 59: Table-17 (Contd..) stAtewise, MontH
- Page 62 and 63: Table - 17 (Contd...) stAtewise, Mo
- Page 64: 2006 2007 2008 2009 indigenous impo
- Page 68 and 69: Table - 19 PRodUCtion, iMPoRts And
- Page 70 and 71: iNPUT SUrVeY, 2001-02 Table - 21 US
- Page 72 and 73: department of fertilizers ministry
- Page 74: Foodgrain Production (In Million MT
- Page 78 and 79: department of fertilizers ministry
- Page 80: Months Urea (FoB) department of fer
- Page 84 and 85: Years department of fertilizers min
- Page 86 and 87: department of fertilizers ministry
- Page 88: POLICY NOTIFICATIONS
- Page 91 and 92: 82 indian fertilizer scenario 2010
- Page 93 and 94: 84 indian fertilizer scenario 2010
- Page 95 and 96: 86 indian fertilizer scenario 2010
- Page 97 and 98: 88 indian fertilizer scenario 2010
- Page 99 and 100: 90 indian fertilizer scenario 2010
- Page 101 and 102: 92 indian fertilizer scenario 2010
- Page 103 and 104: 94 indian fertilizer scenario 2010
- Page 105 and 106: 96 indian fertilizer scenario 2010
- Page 107 and 108: 98 indian fertilizer scenario 2010
- Page 109 and 110: 100 indian fertilizer scenario 2010
- Page 111 and 112:
102 indian fertilizer scenario 2010
- Page 113 and 114:
104 indian fertilizer scenario 2010
- Page 115 and 116:
106 indian fertilizer scenario 2010
- Page 117 and 118:
108 indian fertilizer scenario 2010
- Page 119 and 120:
110 indian fertilizer scenario 2010
- Page 121 and 122:
112 indian fertilizer scenario 2010
- Page 123 and 124:
114 indian fertilizer scenario 2010
- Page 125 and 126:
116 indian fertilizer scenario 2010
- Page 127 and 128:
118 indian fertilizer scenario 2010
- Page 129 and 130:
120 indian fertilizer scenario 2010
- Page 131 and 132:
122 indian fertilizer scenario 2010
- Page 133 and 134:
124 indian fertilizer scenario 2010
- Page 135 and 136:
126 indian fertilizer scenario 2010
- Page 137 and 138:
128 indian fertilizer scenario 2010
- Page 139 and 140:
130 indian fertilizer scenario 2010
- Page 141 and 142:
132 indian fertilizer scenario 2010
- Page 143 and 144:
134 indian fertilizer scenario 2010
- Page 146:
sl. no. department of fertilizers m
- Page 150 and 151:
department of fertilizers ministry
- Page 152 and 153:
department of fertilizers ministry
- Page 154 and 155:
department of fertilizers ministry
- Page 156 and 157:
department of fertilizers ministry
- Page 158:
i. CAPitAL stRUCtURe And FinAnCiAL