Congratulations to Marc Cutter - Hawaii Automobile Dealers ...
Congratulations to Marc Cutter - Hawaii Automobile Dealers ...
Congratulations to Marc Cutter - Hawaii Automobile Dealers ...

Create successful ePaper yourself
Turn your PDF publications into a flip-book with our unique Google optimized e-Paper software.
Page 3<br />
Covering Data thru September 2012<br />
Covering Data thru September 2012<br />
<strong>Hawaii</strong> Au<strong>to</strong> Outlook<br />
Page 3<br />
Page 3<br />
MARKET MARKET TRACKER: TRACKER: HYBRID HYBRID AND AND ELECTRIC ELECTRIC VEHICLES VEHICLES<br />
MARKET TRACKER: HYBRID AND ELECTRIC VEHICLES<br />
Hybrid & Electric Share Share Declines Declines Slightly Slightly in Third in Quarter Third Quarter<br />
Hybrid & Electric Share Declines Slightly in Third Quarter<br />
8.0<br />
8.0<br />
7.0<br />
7.0<br />
6.0<br />
6.0<br />
5.0<br />
5.0<br />
4.0<br />
4.0<br />
3.0<br />
3.0<br />
2.0<br />
2.0<br />
1.0<br />
1.0<br />
0.0<br />
0.0<br />
Q4<br />
'09 Q4<br />
'09<br />
Q1<br />
'10 Q1<br />
'10<br />
Q2<br />
'10 Q2<br />
'10<br />
COUNTY SCOREBOARD<br />
COUNTY SCOREBOARD<br />
All<br />
All Island<br />
Island Markets<br />
Markets Post Post<br />
Post Big Big<br />
Big Increases increases<br />
increases<br />
Maui new vehicle registrations were up 29.8%<br />
Maui Maui new vehicle registrations registrations were were up 29.8% up 29.8%<br />
The table on the right provides a<br />
summary The table of on each the of right <strong>Hawaii</strong>’s provides four a<br />
retail summary light of vehicle each of markets. <strong>Hawaii</strong>’s The four<br />
table retail is light divided vehicle in<strong>to</strong> four markets. sections. The<br />
Market table is Summary divided in<strong>to</strong> shows four <strong>to</strong>tal sections. new<br />
retail Market light Summary vehicle registrations shows <strong>to</strong>tal dur- new<br />
ing retail the light first vehicle nine months registrations of 2011 dur-<br />
and ing 2012 the first and nine the months percent of change. 2011<br />
The and second 2012 and the third percent sections change. show<br />
Light The second Truck and and Detroit third sections Three mar- show<br />
ket Light share. Truck The and fourth Detroit section Three shows mar-<br />
market ket share. share The fourth figures section for the shows <strong>to</strong>p<br />
10 market selling share light figures vehicle for brands the <strong>to</strong>p in<br />
the 10 state. selling The light <strong>to</strong>p vehicle rated county brands in in<br />
each the state. category The is <strong>to</strong>p shaded. rated The county Maui in<br />
market each category had the is largest shaded. increase, The Maui up<br />
29.8%. market had Detroit the Three largest market increase, share up<br />
was 29.8%. highest Detroit in Kauai Three (24.1%) market share and<br />
lowest was highest in <strong>Hawaii</strong> in Kauai (18.6%). (24.1%) and<br />
lowest in <strong>Hawaii</strong> (18.6%).<br />
Source: Au<strong>to</strong>Count data from Experian<br />
Au<strong>to</strong>motive. Source: Au<strong>to</strong>Count data from Experian<br />
Au<strong>to</strong>motive.<br />
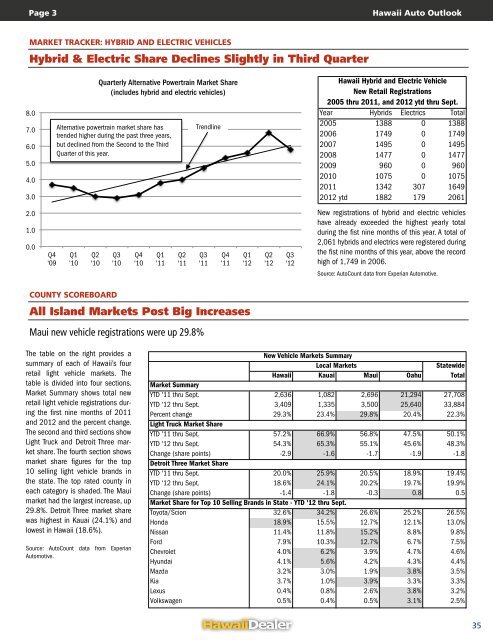
Quarterly Alternative Powertrain Market Share<br />
Quarterly (includes Alternative hybrid and Powertrain electric Market vehicles) Share<br />
(includes hybrid and electric vehicles)<br />
Alternative powertrain market share has<br />
trended Alternative higher powertrain during the market past share three has years,<br />
but trended declined higher from during the Second the past <strong>to</strong> three the Third years,<br />
Quarter but declined of this from year. the Second <strong>to</strong> the Third<br />
Quarter of this year.<br />
Q3<br />
'10 Q3<br />
'10<br />
Q4<br />
'10 Q4<br />
'10<br />
Q1<br />
'11 Q1<br />
'11<br />
Q2<br />
'11 Q2<br />
'11<br />
Trendline<br />
Trendline<br />
Q3<br />
'11 Q3<br />
'11<br />
Q4<br />
'11 Q4<br />
'11<br />
Q1<br />
'12 Q1<br />
'12<br />
Q2<br />
'12 Q2<br />
'12<br />
Q3<br />
'12 Q3<br />
'12<br />
<strong>Hawaii</strong> Hybrid and Electric Vehicle<br />
<strong>Hawaii</strong> New Hybrid Retail and Registrations Electric Vehicle<br />
2005 thru New 2011, Retail and Registrations 2012 ytd thru Sept.<br />
Year 2005 thru 2011, Hybrids and 2012 Electrics ytd thru Sept. Total<br />
2005 Year Hybrids 1388 Electrics 0 1388 Total<br />
2006 2005 1749 1388 0 1749 1388<br />
2007 2006 1495 1749 0 1495 1749<br />
2008 2007 1477 1495 0 1477 1495<br />
2009 2008 1477 960 0 1477 960<br />
2010 2009 1075 960 0 1075 960<br />
2011 2010 1342 1075 3070 1649 1075<br />
2012 2011ytd 1882 1342 179 307 2061 1649<br />
2012 ytd 1882 179 2061<br />
New registrations of hybrid and electric vehicles<br />
have New registrations already exceeded of hybrid the and highest electric yearly vehicles <strong>to</strong>tal<br />
during have already the fist nine exceeded months the of highest this year. yearly A <strong>to</strong>tal <strong>to</strong>tal of<br />
2,061 during hybrids the fist and nine electrics months were of this registered year. A <strong>to</strong>tal during of<br />
the 2,061 fist hybrids nine months and electrics of this year, were above registered the record during<br />
high the fist of 1,749 nine months in 2006. of this year, above the record<br />
high of 1,749 in 2006.<br />
Source: Au<strong>to</strong>Count data from Experian Au<strong>to</strong>motive.<br />
Source: Au<strong>to</strong>Count data from Experian Au<strong>to</strong>motive.<br />
New Vehicle Markets Summary<br />
New Vehicle Markets Local Summary Markets<br />
<strong>Hawaii</strong> Local KauaiMarkets Maui<br />
Market Summary<br />
<strong>Hawaii</strong> Kauai Maui<br />
YTD Market '11 thru Summary Sept. 2,636 1,082 2,696<br />
YTD YTD '12 '11 thru thru Sept. Sept. 3,409 2,636 1,335 1,082 3,500 2,696<br />
Percent YTD '12 change thru Sept. 29.3% 3,409 23.4% 1,335 29.8% 3,500<br />
Light Percent Truck change Market Share<br />
29.3% 23.4% 29.8%<br />
YTD Light '11 Truck thru Market Sept. Share<br />
57.2% 66.9% 56.8%<br />
YTD YTD '12 '11 thru thru Sept. Sept. 54.3% 57.2% 65.3% 66.9% 55.1% 56.8%<br />
Change YTD '12 (share thru Sept. points) 54.3% -2.9 65.3% -1.6 55.1% -1.7<br />
Detroit Change Three (share Market points) Share<br />
-2.9 -1.6 -1.7<br />
YTD Detroit '11 thru Three Sept. Market Share<br />
20.0% 25.9% 20.5%<br />
YTD YTD '12 '11 thru thru Sept. Sept. 18.6% 20.0% 24.1% 25.9% 20.2% 20.5%<br />
Change YTD '12 (share thru Sept. points) 18.6% -1.4 24.1% -1.8 20.2% -0.3<br />
Market Change Share (share for points) Top 10 Selling Brands in State -1.4- YTD '12 thru -1.8 Sept. -0.3<br />
Toyota/Scion Market Share for Top 10 Selling Brands in 32.6% State - YTD '12 34.2% thru Sept. 26.6%<br />
Honda Toyota/Scion 18.9% 32.6% 15.5% 34.2% 12.7% 26.6%<br />
Nissan Honda 11.4% 18.9% 11.8% 15.5% 15.2% 12.7%<br />
Ford Nissan 11.4% 7.9% 10.3% 11.8% 12.7% 15.2%<br />
Chevrolet Ford 4.0% 7.9% 10.3% 6.2% 12.7% 3.9%<br />
Hyundai Chevrolet 4.1% 4.0% 5.6% 6.2% 4.2% 3.9%<br />
Mazda Hyundai 3.2% 4.1% 3.0% 5.6% 1.9% 4.2%<br />
Kia Mazda 3.7% 3.2% 1.0% 3.0% 3.9% 1.9%<br />
Lexus Kia 0.4% 3.7% 0.8% 1.0% 2.6% 3.9%<br />
Volkswagen Lexus 0.5% 0.4% 0.4% 0.8% 0.5% 2.6%<br />
Volkswagen 0.5% 0.4% 0.5%<br />
Oahu<br />
Oahu<br />
21,294<br />
25,640 21,294<br />
25,640 20.4%<br />
20.4%<br />
47.5%<br />
45.6% 47.5%<br />
45.6% -1.9<br />
-1.9<br />
18.9%<br />
19.7% 18.9%<br />
19.7% 0.8<br />
0.8<br />
25.2%<br />
12.1% 25.2%<br />
12.1% 8.8%<br />
6.7% 8.8%<br />
4.7% 6.7%<br />
4.3% 4.7%<br />
3.8% 4.3%<br />
3.3% 3.8%<br />
3.8% 3.3%<br />
3.1% 3.8%<br />
3.1%<br />
Statewide<br />
Statewide Total<br />
Total<br />
27,708<br />
33,884 27,708<br />
33,884 22.3%<br />
22.3%<br />
50.1%<br />
48.3% 50.1%<br />
48.3% -1.8<br />
-1.8<br />
19.4%<br />
19.9% 19.4%<br />
19.9% 0.5<br />
0.5<br />
26.5%<br />
13.0% 26.5%<br />
13.0% 9.8%<br />
7.5% 9.8%<br />
4.6% 7.5%<br />
4.4% 4.6%<br />
3.5% 4.4%<br />
3.3% 3.5%<br />
3.2% 3.3%<br />
2.5% 3.2%<br />
2.5%<br />
35