CBM Progress Report 2006 - GSI
CBM Progress Report 2006 - GSI
CBM Progress Report 2006 - GSI

You also want an ePaper? Increase the reach of your titles
YUMPU automatically turns print PDFs into web optimized ePapers that Google loves.
<strong>CBM</strong> <strong>Progress</strong> <strong>Report</strong> <strong>2006</strong> Simulations<br />
Application of the ω k n test for J/ψ detection in the <strong>CBM</strong> experiment<br />
E.P. Akishina 1 , T.P. Akishina 1 , V.V. Ivanov 1 , A.I. Maevskaya 2 , O.Yu. Denisova 1<br />
The measurement of charmonium is one of the key goals<br />
of the <strong>CBM</strong> experiment. To detect J/ψ meson in its dielectron<br />
decay channel, the main task is the separation of<br />
electrons and pions. We present the electron/pion identification<br />
using energy losses in n = 12 layers of the <strong>CBM</strong><br />
TRD detector applying the ω k n test.<br />
The test criteria that check the correspondence of preassigned<br />
hypothesis (the null-hypothesis H0) against all<br />
possible alternative hypotheses are called the goodness-offit<br />
criteria [1]. The most efficient criteria are based on a<br />
comparison of the distribution function F (x) corresponding<br />
to the null-hypothesis H0 with the empirical distribu-<br />
tion function Sn(x) [2]:<br />
1 LIT JINR, Dubna, Russia, 2 INR,Troitsk,Russia<br />
⎧<br />
⎨ 0, if x < x1;<br />
Sn(x) = i/n, if xi ≤ x ≤ xi+1, i = 1, . . . , n − 1.<br />
⎩<br />
1, if xn ≤ x,<br />
(1)<br />
Here x1 ≤ x2 ≤ . . . ≤ xn is the ordered sample (variational<br />
series) of the size n constructed on the basis of observations<br />
of the variable x.<br />
The testing statistics is a measure of “distance” between<br />
the theoretical F (x) and empirical Sn(x) distribution functions.<br />
In [2] a new class of non-parametric statistics<br />
ω k n = nk/2<br />
∞<br />
−∞<br />
[Sn(x) − F (x)] k f(x)dx (2)<br />
has been proposed: f(x) is the density function corresponding<br />
to H0.<br />
The distributions of energy losses by pions have a Landau<br />
distribution form, and it is resonable to use this distribution<br />
as H0. First, we transfom the initial measurements<br />
to the set of a new variable λ (see details in [3]):<br />
λi = ∆Ei − ∆E i mp<br />
ξi<br />
− 0.225, i = 1,2,...,n, (3)<br />
where ∆Ei is the energy loss in the i-th absorber of<br />
the TRD, ∆Ei mp – the most probable energy loss, ξi =<br />
1<br />
4.02 FWHM of distribution of energy losses of pions in the<br />
i-th absorber [3], n – the number of layers in the TRD. In<br />
order to determine the value ∆Ei mp and the value FWHM,<br />
the indicated distributions were approximated by the lognormal<br />
distribution.<br />
The sample of obtained values λi, i = 1, ..., n was ordered<br />
due to values (λj, j = 1, ..., n) and then used for<br />
ωk n calculation. The values of the Landau distribution function<br />
were calculated with the help of the DSTLAN function<br />
(from the CERNLIB library).<br />
From Monte-Carlo simulation we exactly know which<br />
particle we deal with, and one can choose for combinato-<br />
11<br />
rial background only “real” electrons. For a good signal-tobackground<br />
ratio, the electron identification purity is a crucial<br />
factor. The reconstructed track participates in a combinatorial<br />
background if it satisfies the following criteria:<br />
a) track vertex is inside the target; b) pt is more than 1.2<br />
GeV/c; c) RICH identifies track as electron: the ring radius<br />
is 5.9 to 7 cm; d) full energy loss in all TRD layers is larger<br />
than 70 keV.<br />
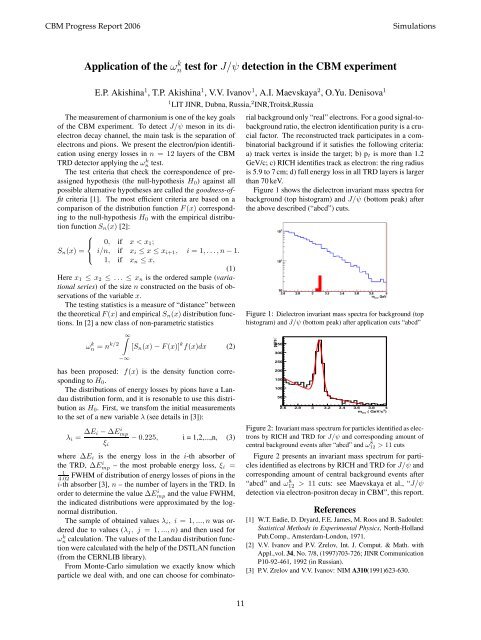
Figure 1 shows the dielectron invariant mass spectra for<br />
background (top histogram) and J/ψ (bottom peak) after<br />
the above described (“abcd”) cuts.<br />
Figure 1: Dielectron invariant mass spectra for background (top<br />
histogram) and J/ψ (bottom peak) after application cuts “abcd”<br />
pairs /<br />
350<br />
300<br />
250<br />
200<br />
150<br />
100<br />
50<br />
2.6<br />
0<br />
2.8 3 3.2 3.4 3.6 3.8 4<br />
2<br />
minv<br />
( GeV/c )<br />
Figure 2: Invariant mass spectrum for particles identified as electrons<br />
by RICH and TRD for J/ψ and corresponding amount of<br />
central background events after “abcd” and ω 8 12 > 11 cuts<br />
Figure 2 presents an invariant mass spectrum for particles<br />
identified as electrons by RICH and TRD for J/ψ and<br />
corresponding amount of central background events after<br />
“abcd” and ω 8 12 > 11 cuts: see Maevskaya et al., “J/ψ<br />
detection via electron-positron decay in <strong>CBM</strong>”, this report.<br />
References<br />
[1] W.T. Eadie, D. Dryard, F.E. James, M. Roos and B. Sadoulet:<br />
Statistical Methods in Experimental Physics, North-Holland<br />
Pub.Comp., Amsterdam-London, 1971.<br />
[2] V.V. Ivanov and P.V. Zrelov, Int. J. Comput. & Math. with<br />
Appl.,vol. 34, No. 7/8, (1997)703-726; JINR Communication<br />
P10-92-461, 1992 (in Russian).<br />
[3] P.V. Zrelov and V.V. Ivanov: NIM A310(1991)623-630.