Effects of Wholesale Lending to SACCOs in Uganda - Rural Finance ...
Effects of Wholesale Lending to SACCOs in Uganda - Rural Finance ...
Effects of Wholesale Lending to SACCOs in Uganda - Rural Finance ...

You also want an ePaper? Increase the reach of your titles
YUMPU automatically turns print PDFs into web optimized ePapers that Google loves.
Total Outstand<strong>in</strong>g Loan Balance<br />
Only one SACCO experienced a decrease <strong>in</strong> its <strong>to</strong>tal outstand<strong>in</strong>g loan balance: Bunyaruguru<br />
SACCO (-31%). The rema<strong>in</strong><strong>in</strong>g five <strong>SACCOs</strong> with external funds saw <strong>in</strong>creases <strong>in</strong> <strong>to</strong>tal<br />
outstand<strong>in</strong>g loan balance. Ikongo SACCO, Kijura SACCO and Bushenyi People’s SACCO<br />
experienced huge <strong>in</strong>creases <strong>of</strong> 504%, 598%, and 906%, respectively, while ZEU SACCO and<br />
Panyimur SACCO saw more modest <strong>in</strong>creases <strong>of</strong> 81% and 89%, respectively. The <strong>to</strong>tal<br />
outstand<strong>in</strong>g loan balances <strong>of</strong> the control <strong>SACCOs</strong>, Kajara People’s and Bugongi, grew 159%<br />
and 170%, respectively. The average <strong>in</strong>crease <strong>in</strong> <strong>to</strong>tal sav<strong>in</strong>gs for <strong>SACCOs</strong> receiv<strong>in</strong>g loans<br />
was UGX 22,417,176; the average <strong>in</strong>crease for the control group was UGX 75,131,332.<br />
Overall Growth<br />
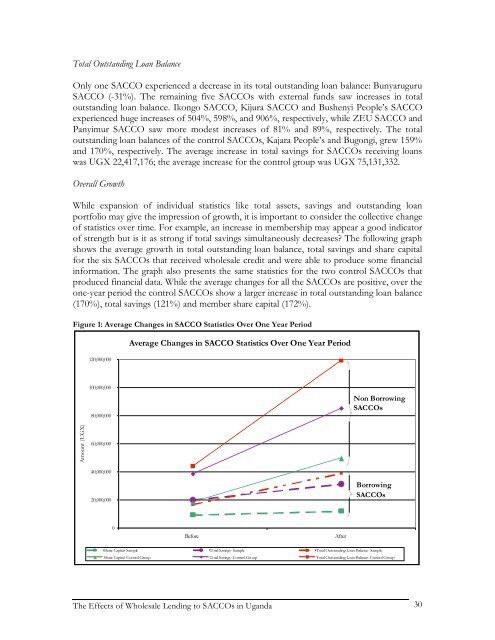
While expansion <strong>of</strong> <strong>in</strong>dividual statistics like <strong>to</strong>tal assets, sav<strong>in</strong>gs and outstand<strong>in</strong>g loan<br />
portfolio may give the impression <strong>of</strong> growth, it is important <strong>to</strong> consider the collective change<br />
<strong>of</strong> statistics over time. For example, an <strong>in</strong>crease <strong>in</strong> membership may appear a good <strong>in</strong>dica<strong>to</strong>r<br />
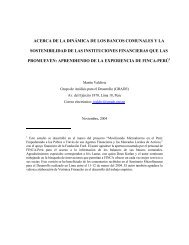
<strong>of</strong> strength but is it as strong if <strong>to</strong>tal sav<strong>in</strong>gs simultaneously decreases? The follow<strong>in</strong>g graph<br />
shows the average growth <strong>in</strong> <strong>to</strong>tal outstand<strong>in</strong>g loan balance, <strong>to</strong>tal sav<strong>in</strong>gs and share capital<br />
for the six <strong>SACCOs</strong> that received wholesale credit and were able <strong>to</strong> produce some f<strong>in</strong>ancial<br />
<strong>in</strong>formation. The graph also presents the same statistics for the two control <strong>SACCOs</strong> that<br />
produced f<strong>in</strong>ancial data. While the average changes for all the <strong>SACCOs</strong> are positive, over the<br />
one-year period the control <strong>SACCOs</strong> show a larger <strong>in</strong>crease <strong>in</strong> <strong>to</strong>tal outstand<strong>in</strong>g loan balance<br />
(170%), <strong>to</strong>tal sav<strong>in</strong>gs (121%) and member share capital (172%).<br />
Figure 1: Average Changes <strong>in</strong> SACCO Statistics Over One Year Period<br />
Amount (UGX)<br />
120,000,000<br />
100,000,000<br />
80,000,000<br />
60,000,000<br />
40,000,000<br />
20,000,000<br />
0<br />
Average Changes <strong>in</strong> SACCO Statistics Over One Year Period<br />
Before After<br />
The <strong>Effects</strong> <strong>of</strong> <strong>Wholesale</strong> <strong>Lend<strong>in</strong>g</strong> <strong>to</strong> <strong>SACCOs</strong> <strong>in</strong> <strong>Uganda</strong><br />
Non Borrow<strong>in</strong>g<br />
<strong>SACCOs</strong><br />
Borrow<strong>in</strong>g<br />
<strong>SACCOs</strong><br />
Share Capital- Sample Total Sav<strong>in</strong>gs- Sample Total Outstand<strong>in</strong>g Loan Balance- Sample<br />
Share Capital- Control Group Total Sav<strong>in</strong>gs- Control Group Total Outstand<strong>in</strong>g Loan Balance- Control Group<br />
30