

Mobile Device Power Monitor Manual - GitHub Pages
Mobile Device Power Monitor Manual - GitHub Pages
Mobile Device Power Monitor Manual - GitHub Pages

You also want an ePaper? Increase the reach of your titles
YUMPU automatically turns print PDFs into web optimized ePapers that Google loves.
26<br />
Functional Description of the <strong>Power</strong> <strong>Monitor</strong><br />
To measure the current accurately, a dual range, self-calibrating, integrating system is<br />
used. Each channel has two current ranges with a 16-bit analog-to-digital converter (ADC),<br />
one with a high-resolution range, and the other with a low-resolution range. Software<br />
continuously calibrates each of these and selects the proper range during measurement.<br />
The dual range scheme works because mobile devices are usually in standby mode and<br />
drawing only a few milliamps of current, or they are running above 100 milliamps. The<br />
<strong>Power</strong> <strong>Monitor</strong> must be very accurate when the current is low, but may be less accurate as<br />
the current increases. Each sample is integrated over its 200-microsecond sample period so<br />
that even a brief high-current pulse is captures. Depending on system capacitance and<br />
other factors, the fastest transient pulses are around 20 microseconds. The integrator sums<br />
up these fast pulses so that an accurate assessment of the average current is maintained.<br />
The unit is self-calibrating. One cycle out of every 1000 cycles is used to run either a zerocurrent<br />
calibration or a reference-current calibration. Software uses these measurements to<br />
null out the offset and gain errors in the system. Because this is done automatically, it<br />
compensates for slow temperature changes during the measurement run.<br />
The only part not included in the self-calibration is the sense resistor. These resistors are<br />
calibrated at the factory and the calibration values may be adjusted and saved by engineers<br />
using the Parameters dialog box. The <strong>Power</strong> <strong>Monitor</strong> has an overflow buffer that can hold six<br />
packets of 128 bytes each. During transfer, if the development workstation cannot read the<br />
data fast enough then this buffer will begin to fill up, and samples may be lost. The received<br />
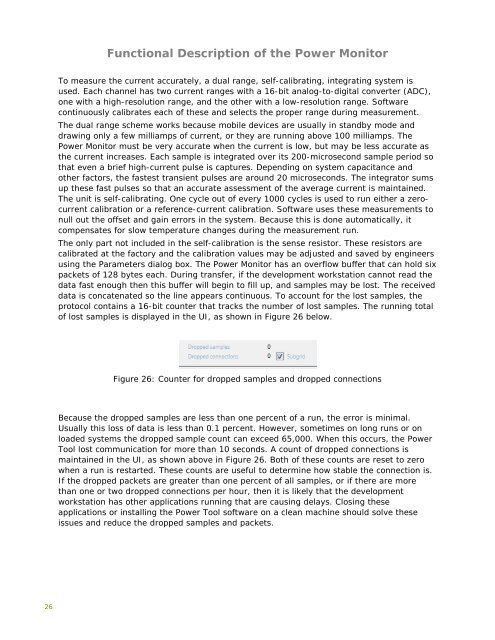
data is concatenated so the line appears continuous. To account for the lost samples, the<br />
protocol contains a 16-bit counter that tracks the number of lost samples. The running total<br />
of lost samples is displayed in the UI, as shown in Figure 26 below.<br />
Figure 26: Counter for dropped samples and dropped connections<br />
Because the dropped samples are less than one percent of a run, the error is minimal.<br />
Usually this loss of data is less than 0.1 percent. However, sometimes on long runs or on<br />
loaded systems the dropped sample count can exceed 65,000. When this occurs, the <strong>Power</strong><br />
Tool lost communication for more than 10 seconds. A count of dropped connections is<br />
maintained in the UI, as shown above in Figure 26. Both of these counts are reset to zero<br />
when a run is restarted. These counts are useful to determine how stable the connection is.<br />
If the dropped packets are greater than one percent of all samples, or if there are more<br />
than one or two dropped connections per hour, then it is likely that the development<br />
workstation has other applications running that are causing delays. Closing these<br />
applications or installing the <strong>Power</strong> Tool software on a clean machine should solve these<br />
issues and reduce the dropped samples and packets.