The Million Pound Donors Report 2012 - University of Kent
The Million Pound Donors Report 2012 - University of Kent
The Million Pound Donors Report 2012 - University of Kent

You also want an ePaper? Increase the reach of your titles
YUMPU automatically turns print PDFs into web optimized ePapers that Google loves.
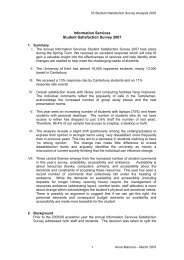
6. Are million pound donations ‘banked’ or<br />
‘spent’?<br />
In 2010/11 we found over half (60%) <strong>of</strong> the value <strong>of</strong> million<br />
pound donations went directly to front-line operating<br />
charities, whilst 40% was placed into charitable trusts and<br />
foundations for distribution to good causes at a later date.<br />
table 3: the distribution <strong>of</strong> ‘banked’ and ‘spent’ million pound donations from 2006/07 – 2010/11<br />
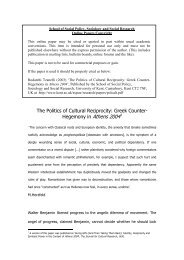
7. <strong>The</strong> recipients <strong>of</strong> million pound donations<br />
A total <strong>of</strong> 191 organisations were recipients <strong>of</strong> million<br />
pound donations in 2010/11 – far higher than the 154<br />
recipients identified in 2009/10. <strong>The</strong> 191 organisations<br />
include both operating charities and charitable trusts and<br />
foundations. <strong>The</strong> vast majority (166) received only one<br />
donation worth £1 million or more. Organisations that<br />
received multiple million pound donations are primarily<br />
table 4: the recipients <strong>of</strong> million pound donations in 2010/11<br />
the MIllIon PoUnd donors rePort <strong>2012</strong><br />
Over the first three years that this data has been collected,<br />
we identified a trend towards putting money to work more<br />
quickly rather than building up charitable endowments, as<br />
larger and larger percentages were ‘spent’ rather than<br />
‘banked’. In 2009/10 there was a shift in the other<br />
direction, with 52% put into foundations, but as table 3<br />
shows, the most recent data indicates that the longer-term<br />
trend is towards getting philanthropic money out onto the<br />
front-line.<br />
Year Table headAmount Table ‘banked’ head in foundations Amount ‘spent’ Table directly head on charitable beneficiaries<br />
2006/07 table text table text £913m (56%) table text<br />
£705m (44%)<br />
2007/08 table text table text £597m (42%) table text<br />
£808m (58%)<br />
2008/09 table text table text £550m (36%) table text<br />
£998m (64%)<br />
2009/10 table text table text £681m (52%) table text<br />
£631m (48%)<br />
2010/11 £494m (40%) £747m (60%)<br />
well-known universities or national arts and cultural<br />
organisations, but a hospital, an environmental<br />
organisation and a cancer research charity also received<br />
more than one seven-figure plus donation.<br />
<strong>The</strong> only organisations in need <strong>of</strong> ‘two hands’ to count<br />
their million pound donations are the universities <strong>of</strong><br />
Oxford and Cambridge.<br />
Number <strong>of</strong> organisations receiving this many<br />
Number <strong>of</strong> million pound gifts received<br />
million pound donations in 2010/11<br />
1 166<br />
2 20<br />
3 0<br />
4 3<br />
5 0<br />
6 1<br />
7 0<br />
8 1<br />
11